
I design and develop dashboards and workflow automation systems for teams across the organization. The core principle is simple: each team member records their daily work once through their own dedicated page. The data then flows into a central database, automatically updating dashboards, calendar views, KPI reports, and performance tracking in real time.
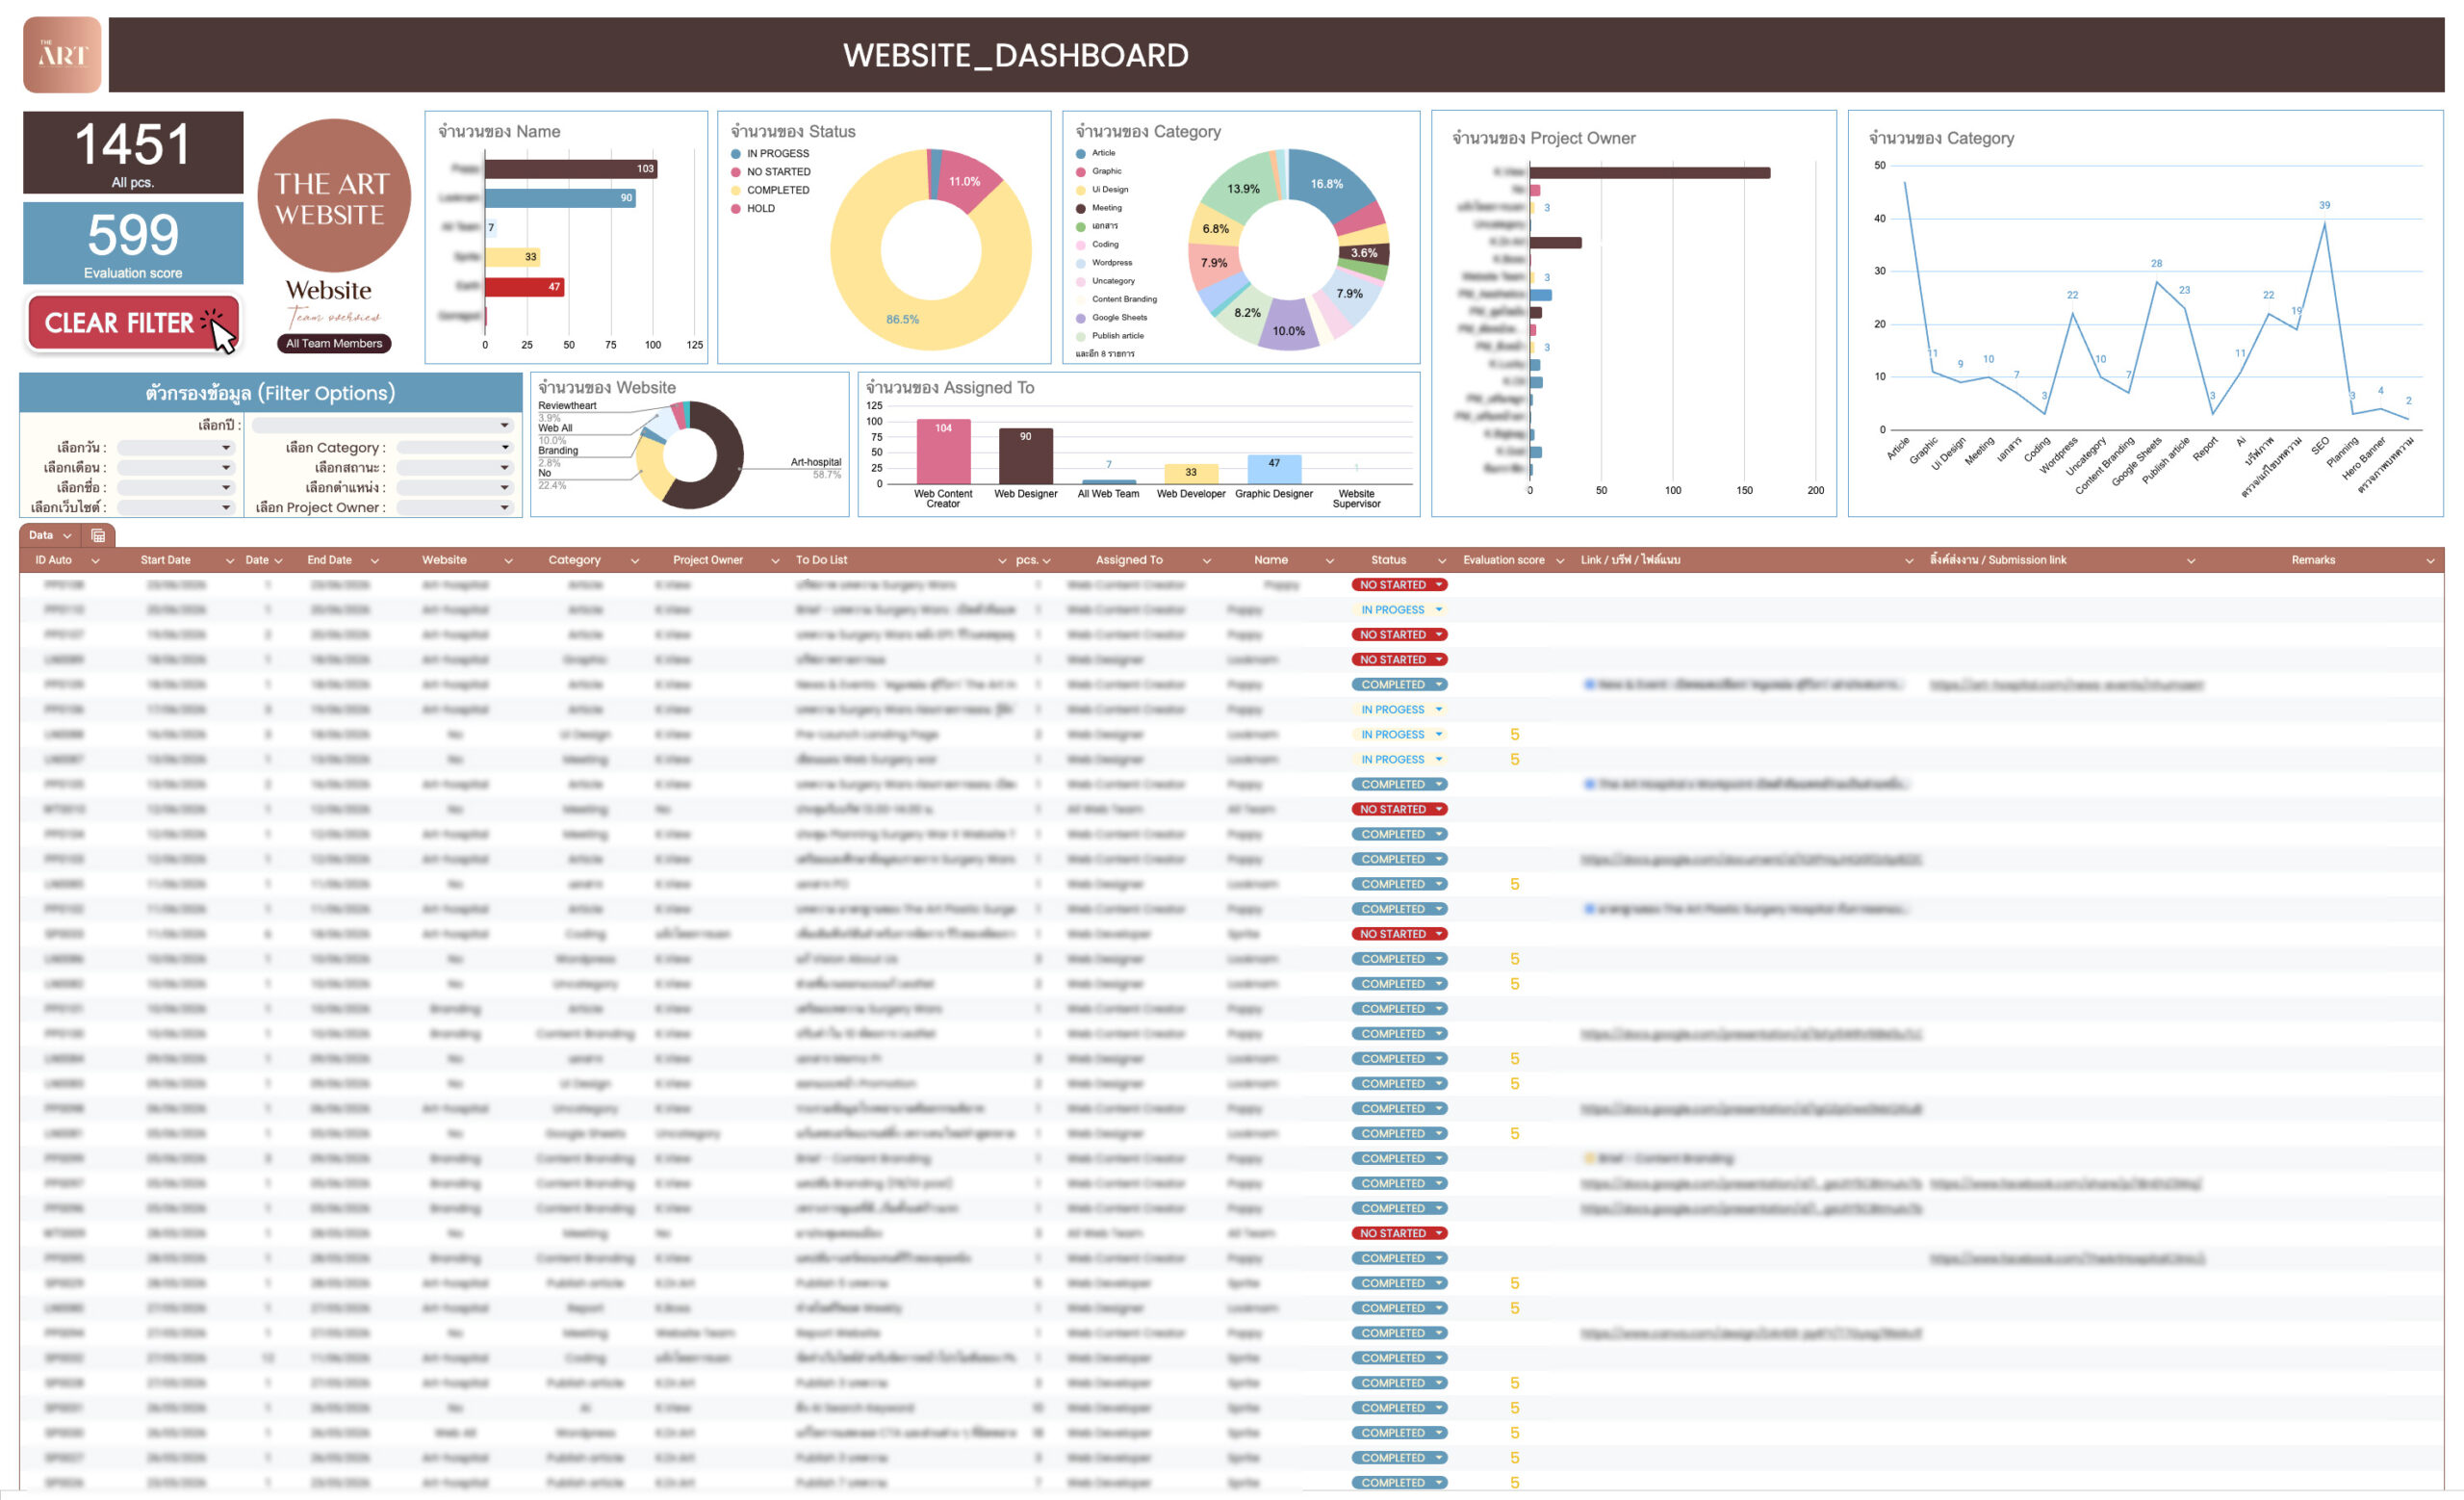
Tracking the website team’s work previously required opening multiple files and checking each person’s progress separately. Consolidating the data was time-consuming and made it difficult to see the team’s overall workload.
I designed a central dashboard connected to a single database, with charts and reports that update in real time. Users can instantly filter information by task type, website, or person responsible.
View all task statuses in one place.
Reduce the time team leaders spend following up on tasks.
Analyze team performance and workload in real time.
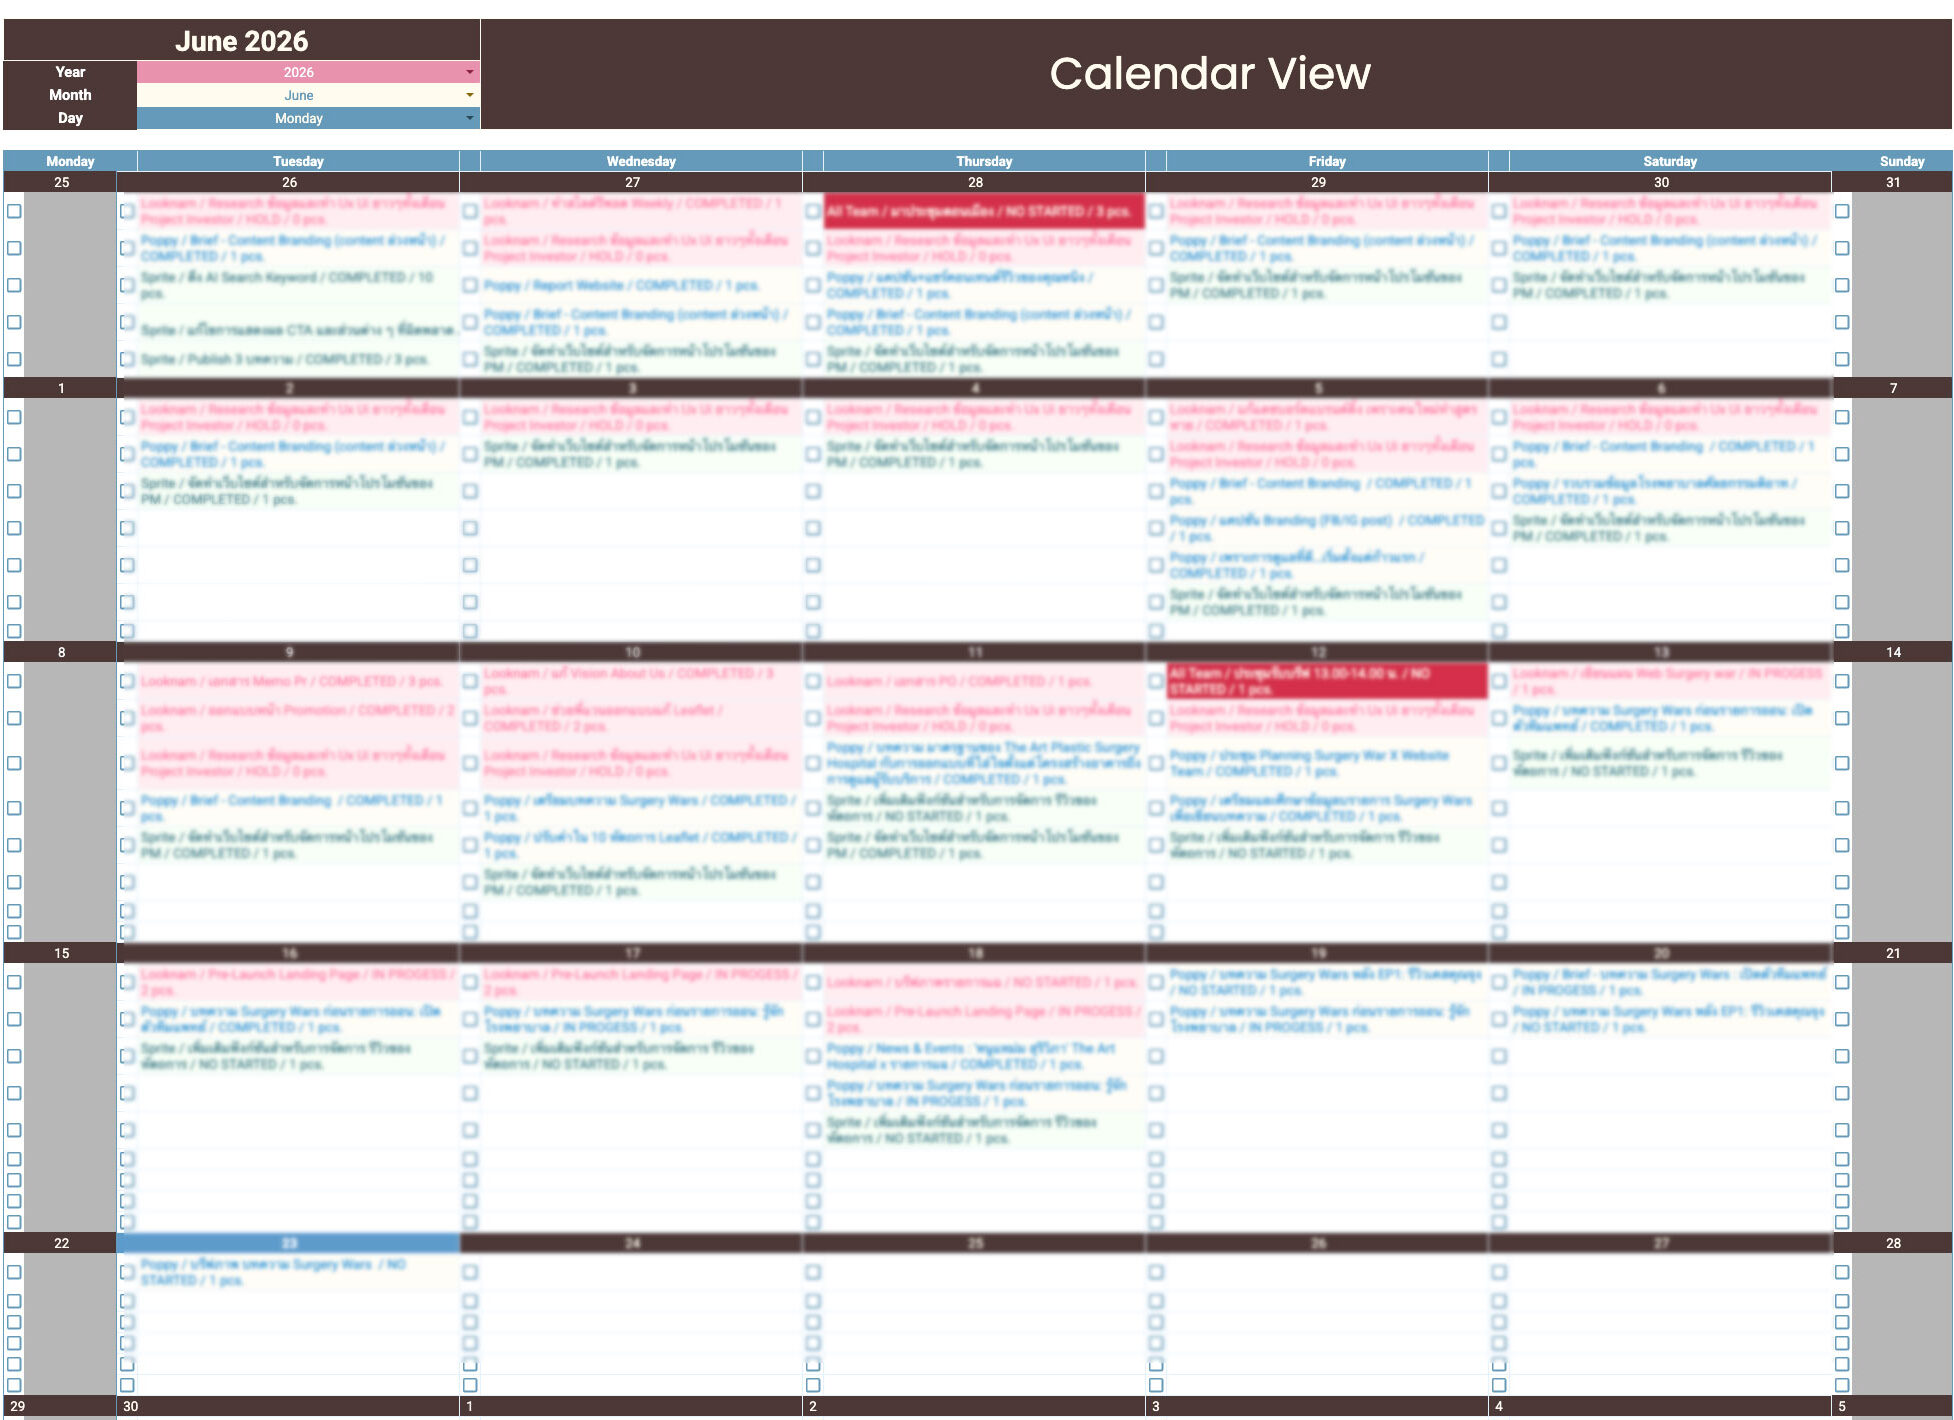
Although the dashboard provided an overview, it was still difficult to see the team’s daily workload. Team members had to check multiple spreadsheets to find out what was scheduled for each day.
I developed a calendar view that automatically displays information from the central database, eliminating the need to enter the same data twice.
View daily, weekly, and monthly tasks at a glance.
Reduce scheduling conflicts.
Plan resources and deadlines more easily.
Keep everyone working from the same information.
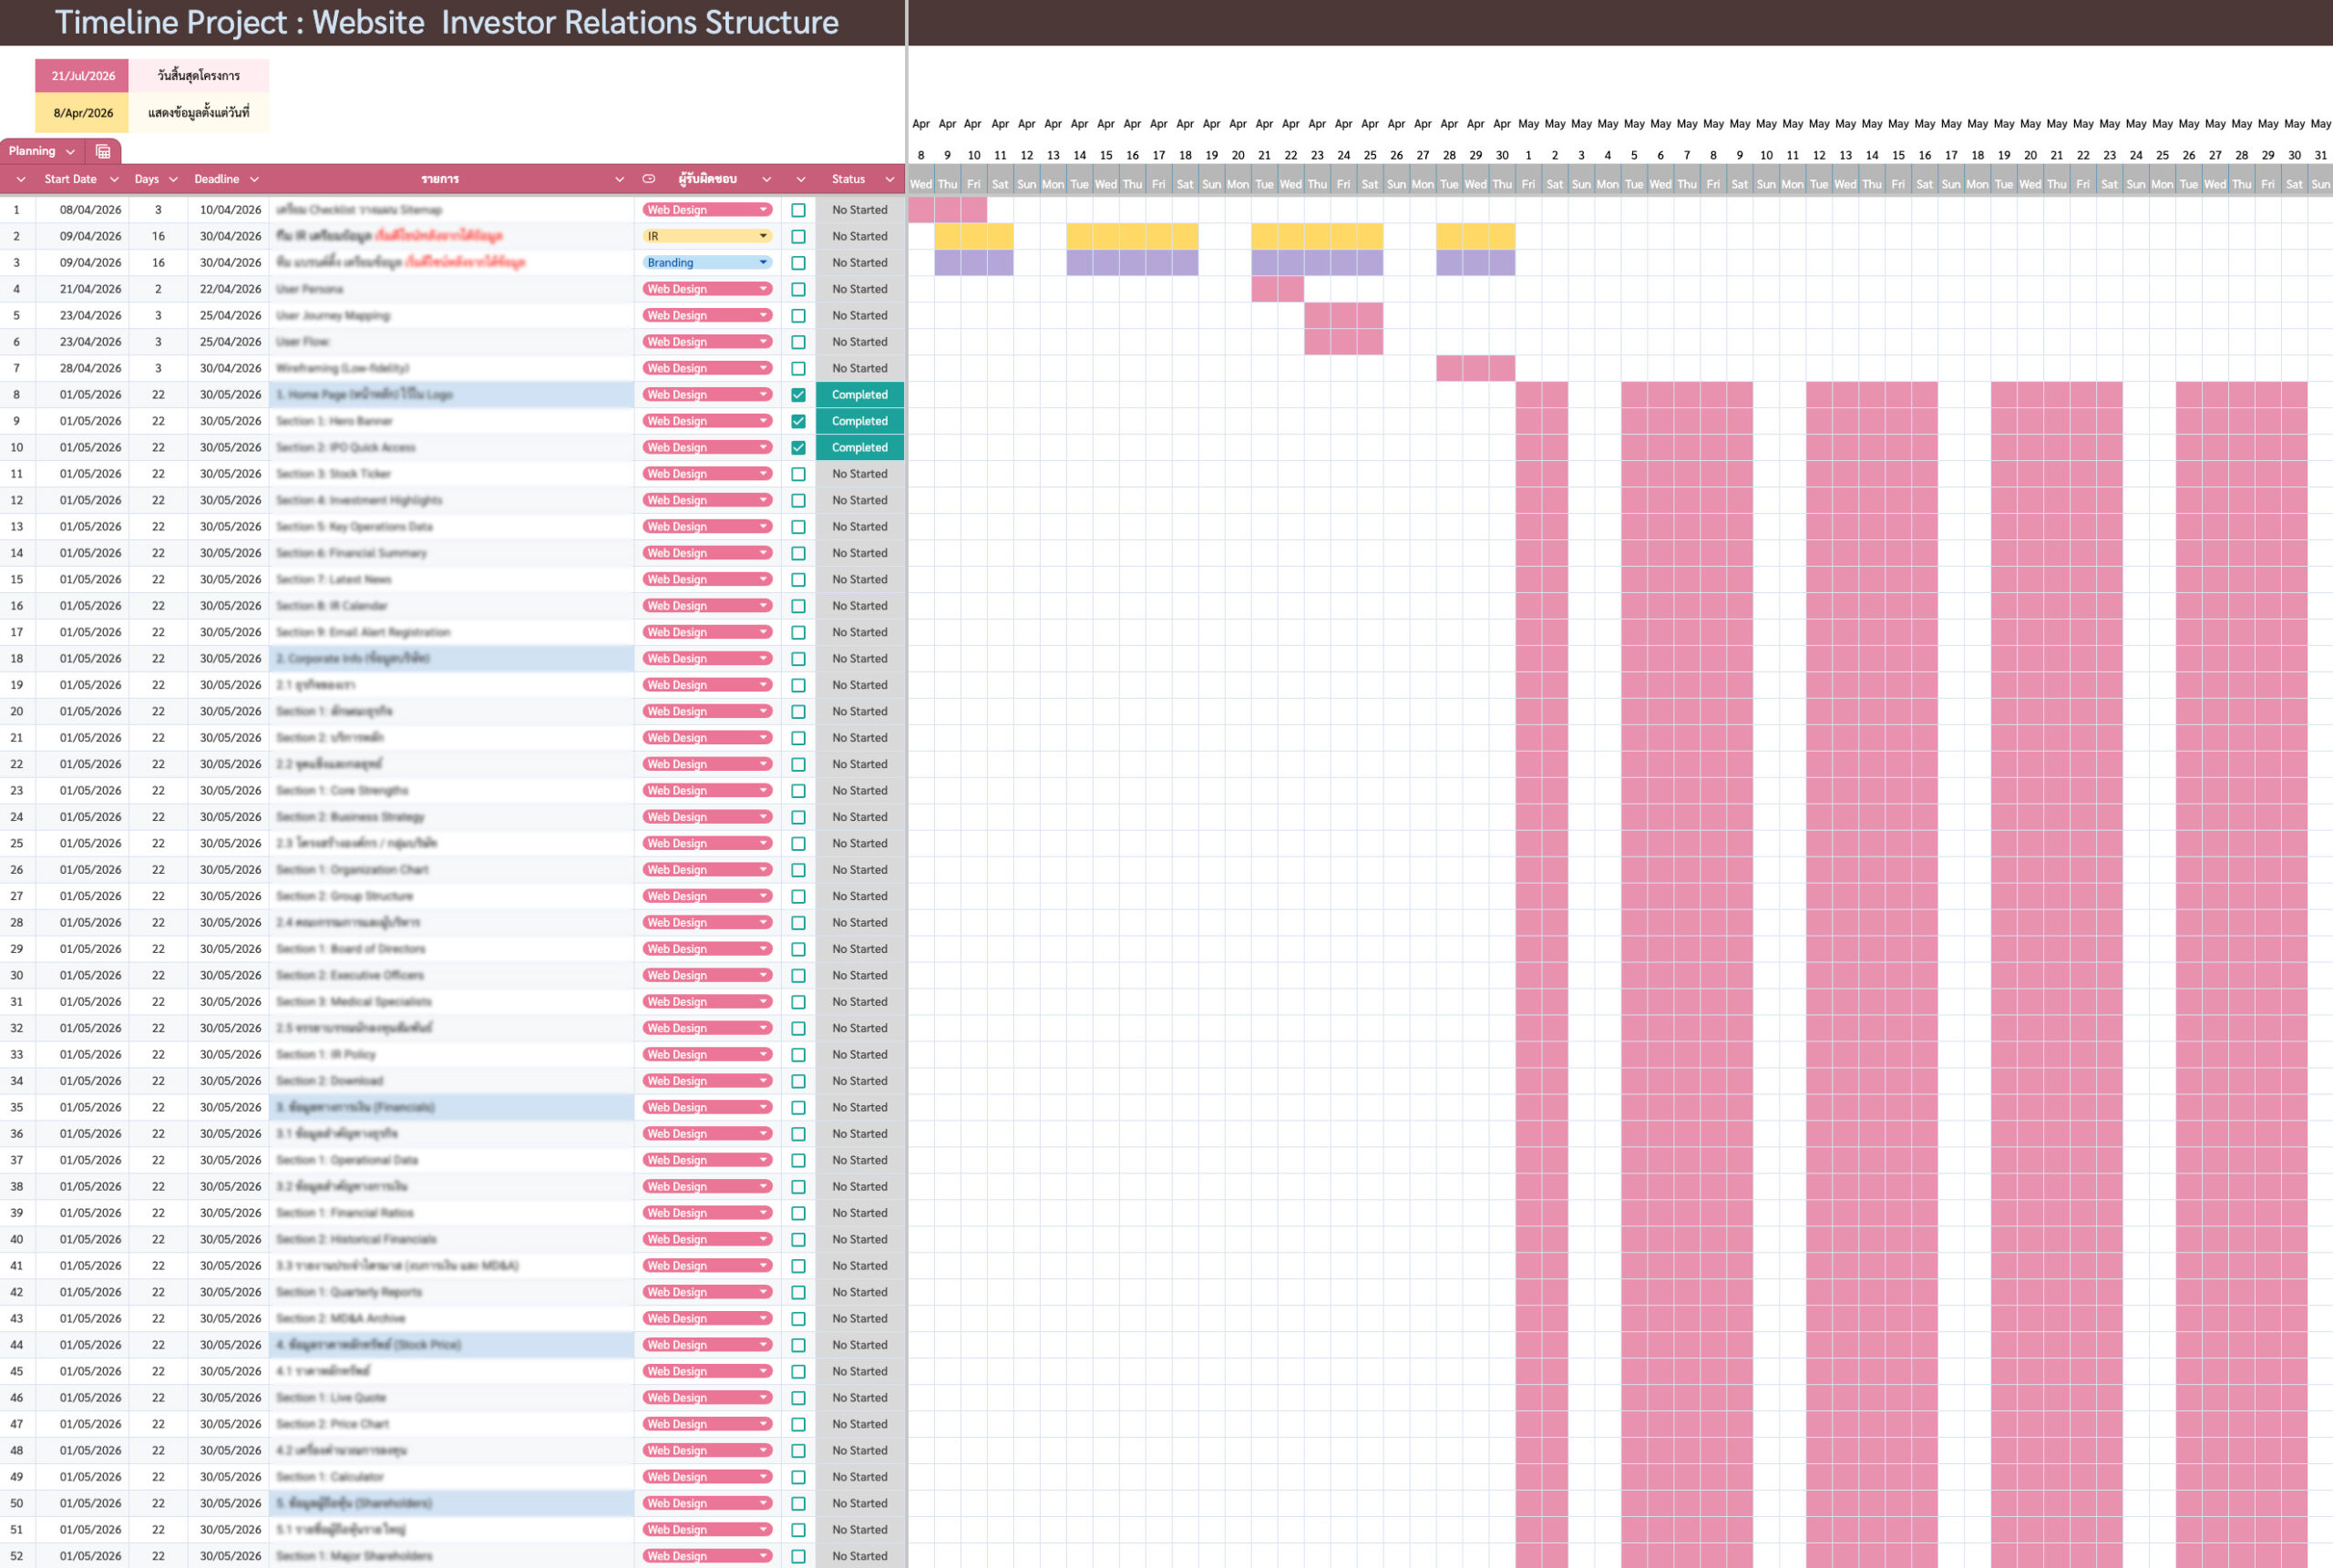
Large projects, such as an investor relations website, involve multiple phases and contributors. Tracking them in a standard spreadsheet made it difficult to see the full picture.
I designed a timeline and Gantt chart system that clearly shows task sequences, durations, and progress.
Identify the project’s critical path.
Track progress more easily.
Reduce the risk of delays.
Manage projects in a more structured way.
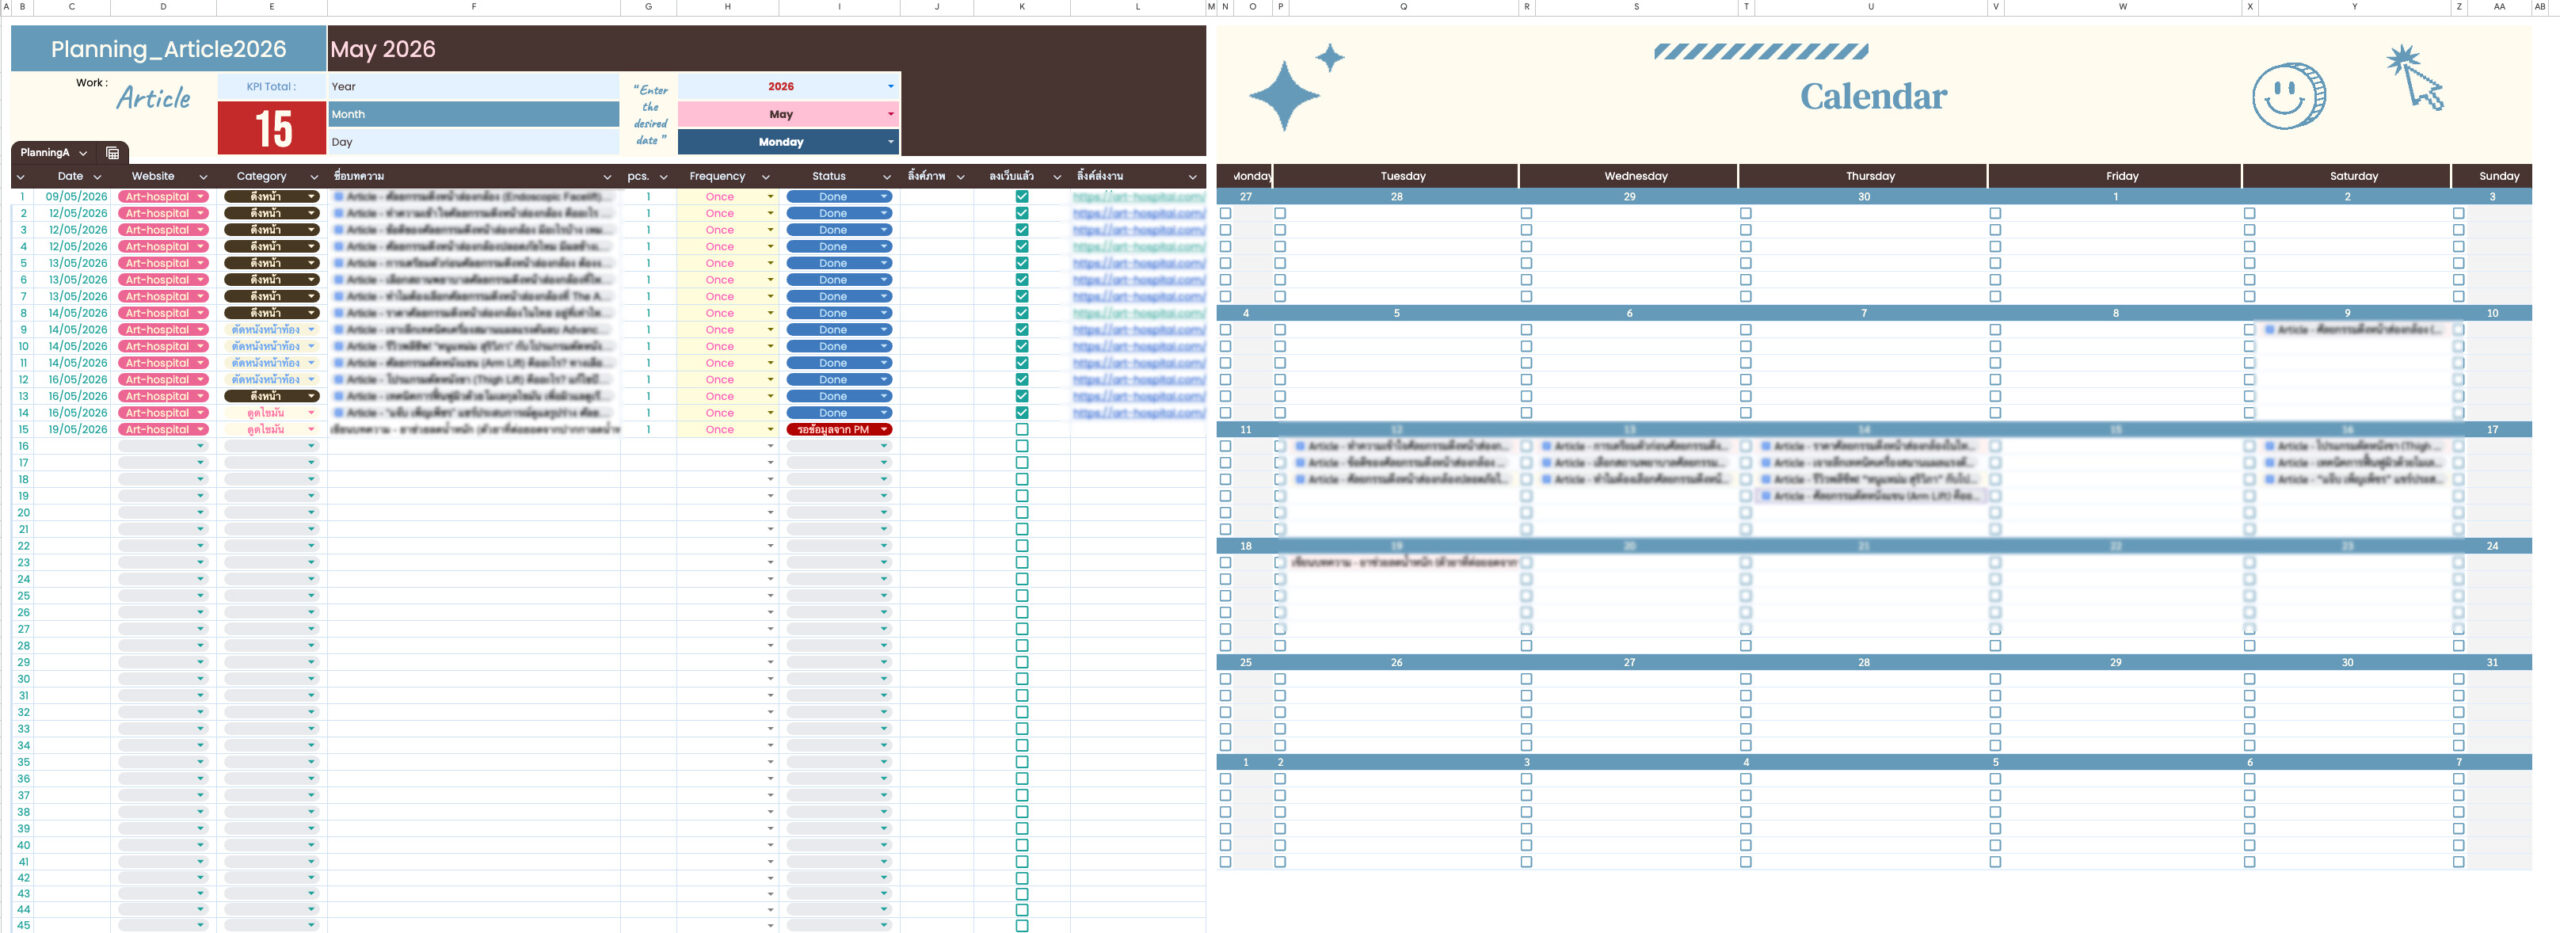
The content team manages a large volume of articles, including topics, production stages, and publication dates.
I developed a content planner that automatically syncs with a calendar. Once an entry is recorded, it appears on the calendar immediately.
Plan content ahead of time.
Keep articles from being overlooked.
Track every stage of content production.
Coordinate work between the content and website teams.
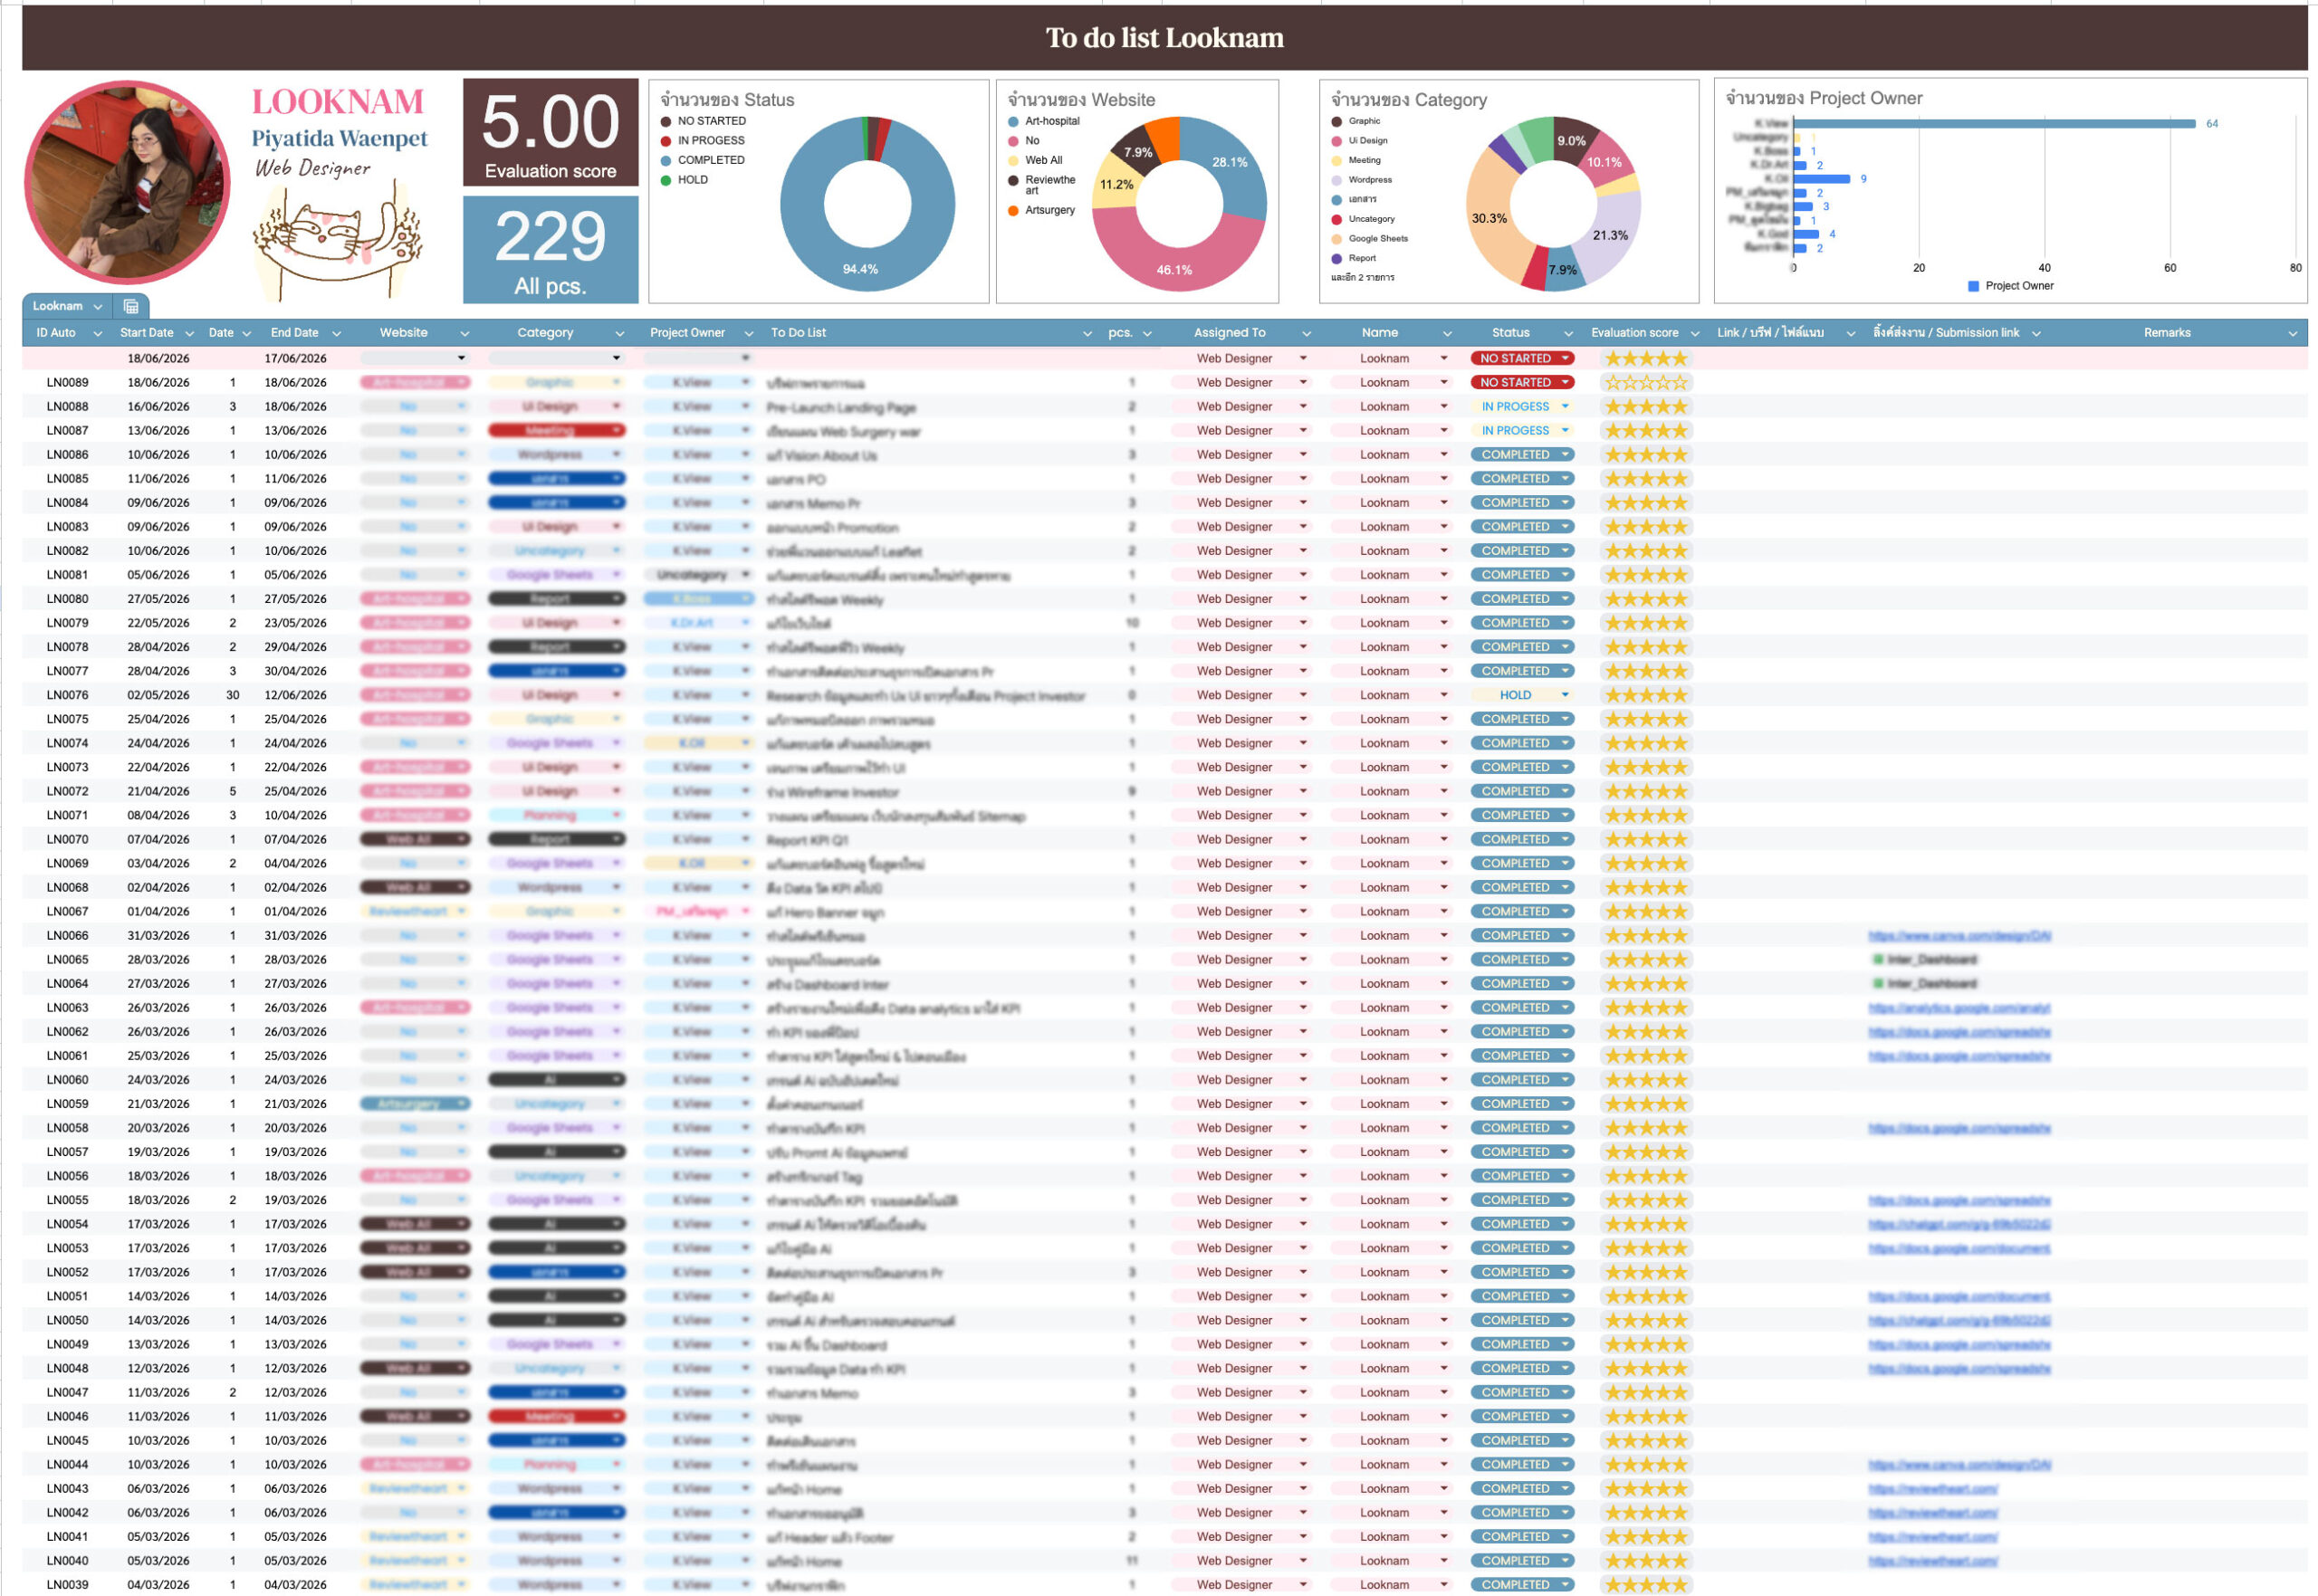
Alongside the team overview, I designed individual dashboards that allow employees to monitor their own performance. Each dashboard displays task counts, evaluation scores, task statuses, and a breakdown of the types of work assigned to them.
Gain visibility into individual productivity.
Track personal goals clearly.
Support performance reviews with relevant data.
Encourage a data-driven working culture.
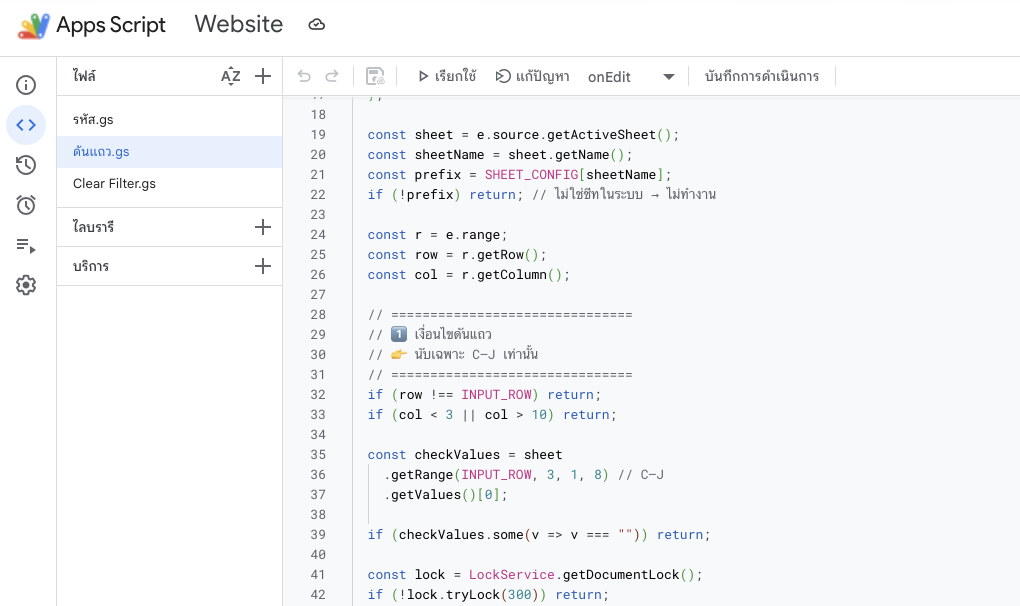
One recurring challenge in Google Sheets was having to scroll to the bottom of the sheet whenever a new record needed to be added.
I developed an automated workflow using Google Apps Script that allows users to enter information once in the top row. The system then generates a unique ID, saves the record to the database, places the new entry in the correct order, and updates connected dashboards, calendar views, and reports automatically.
Simplify daily data entry.
Generate unique IDs and organize records automatically.
Update connected dashboards and reports immediately.
Reduce errors caused by manual data entry.
Improve workflow efficiency across the team.
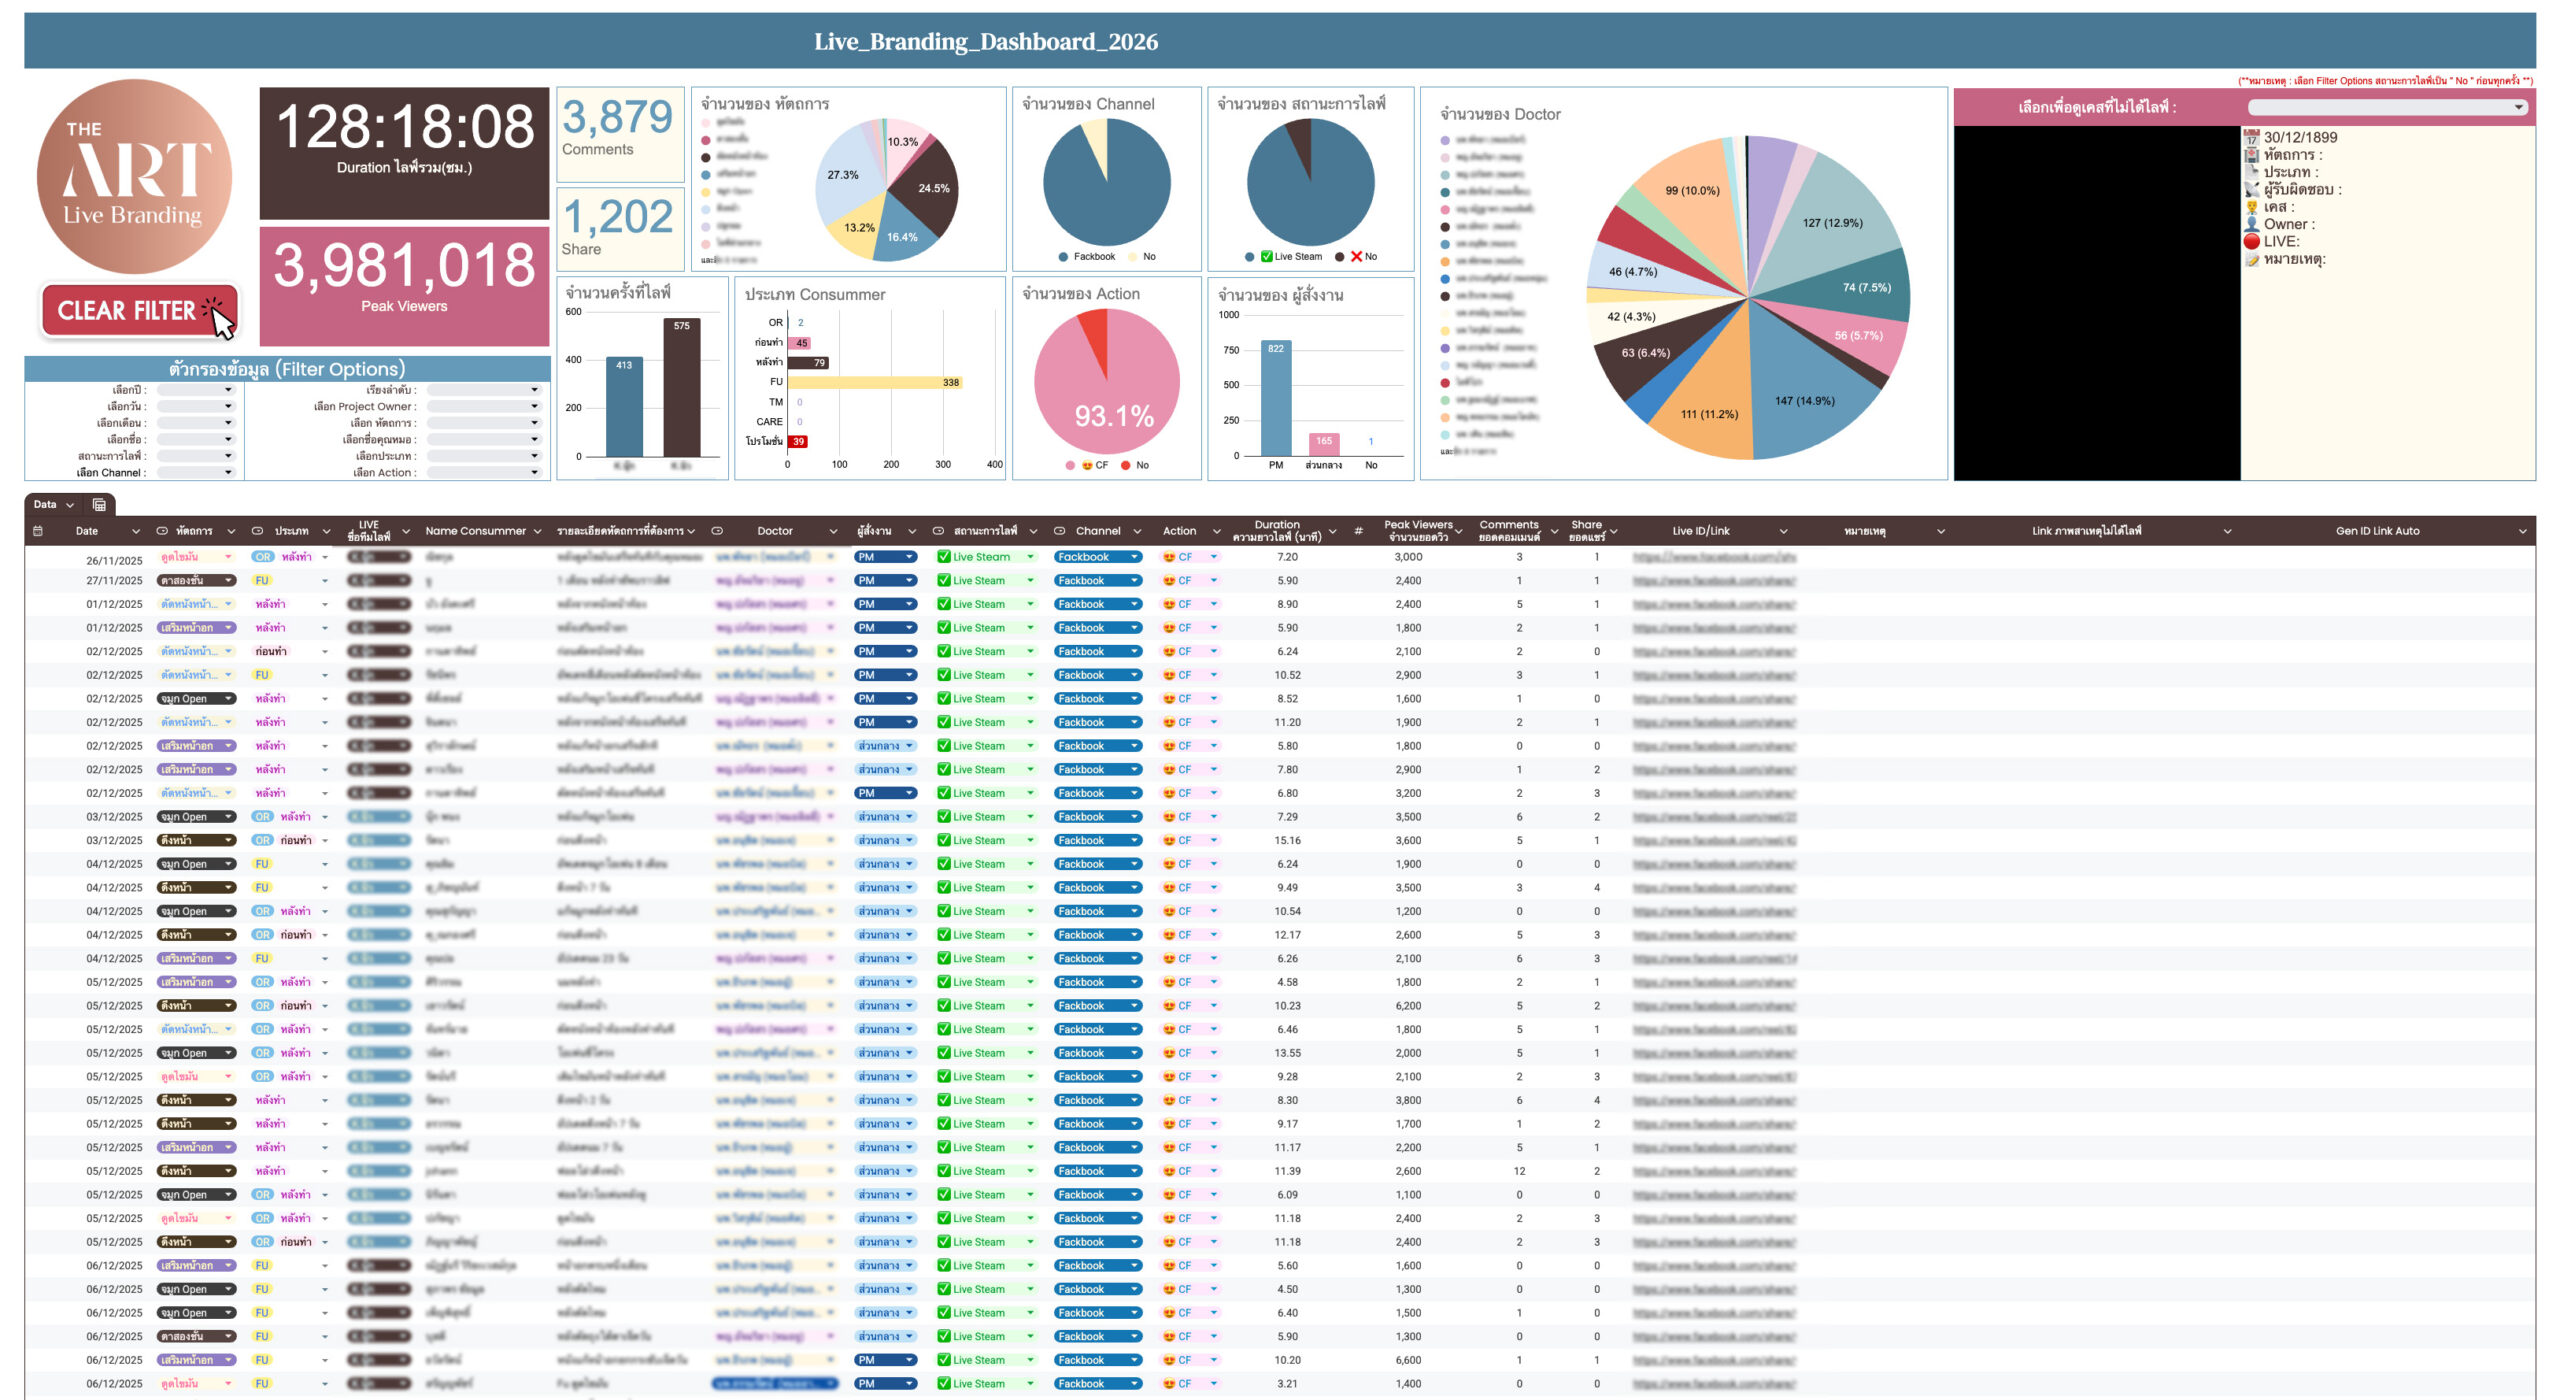
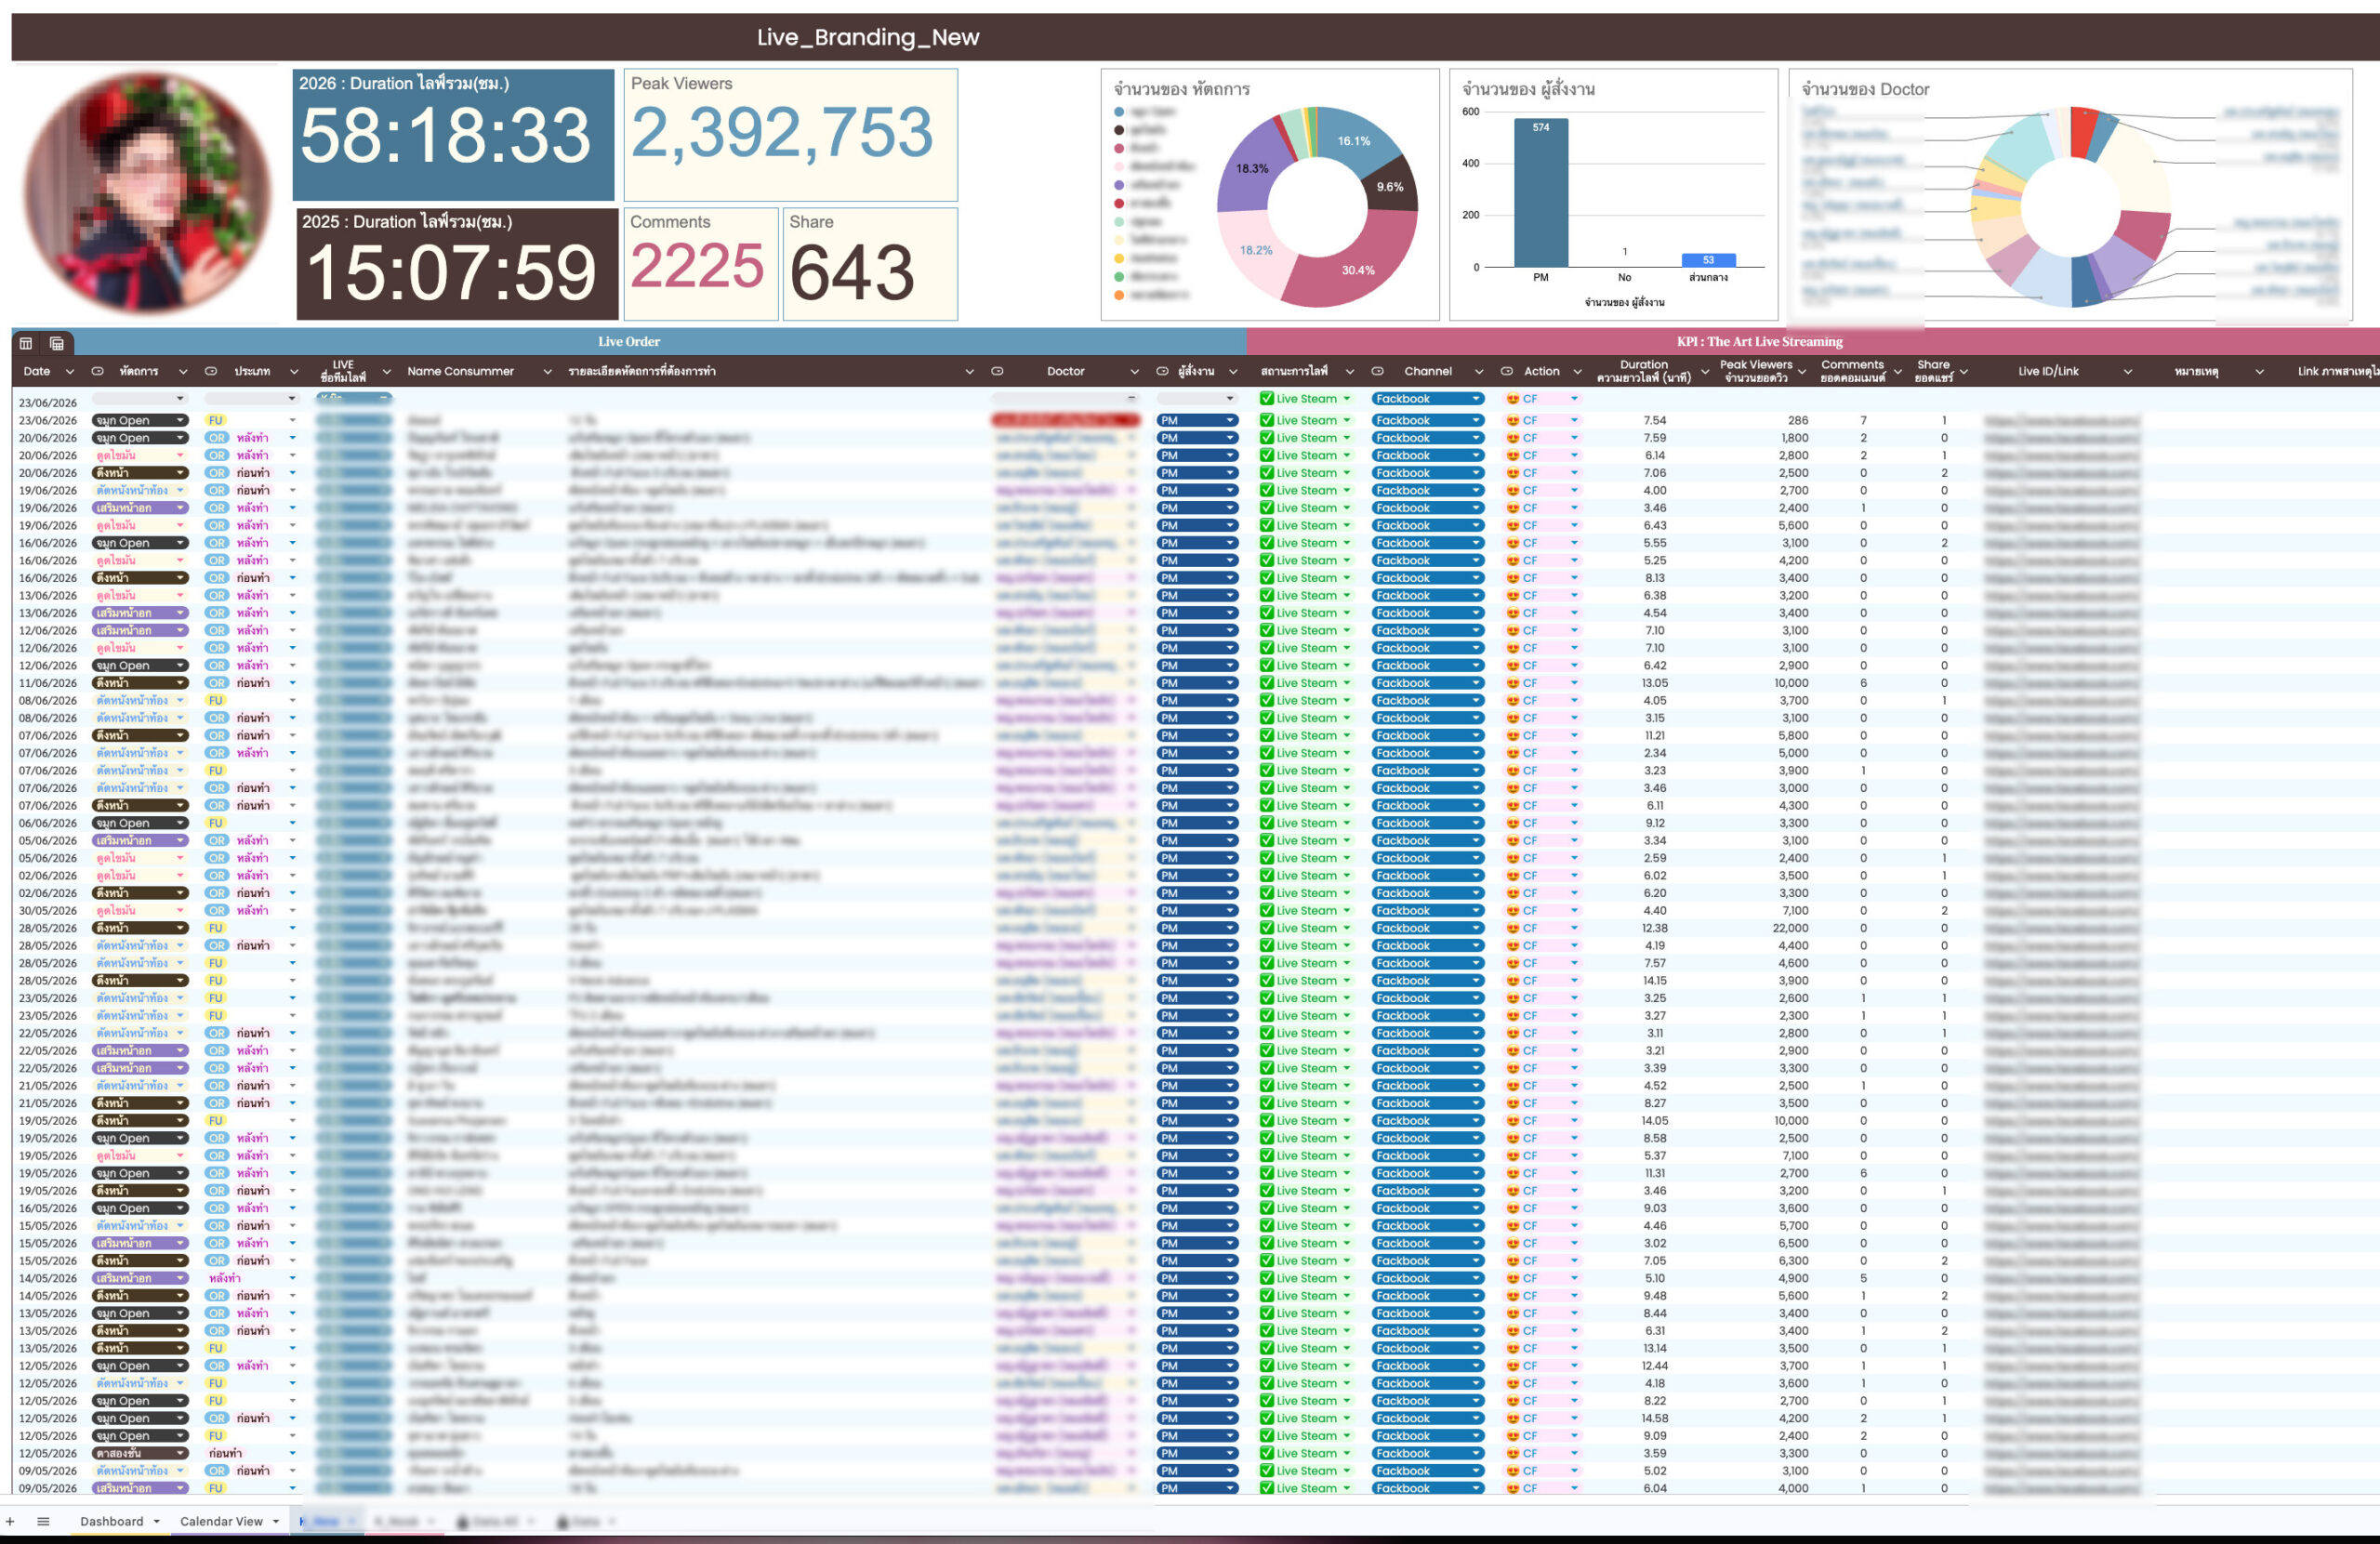
Tracking the branding team’s live streaming results previously involved gathering information from multiple sources, including production staff, doctors, hosts, stream duration, viewer counts, and engagement. Preparing monthly summaries was time-consuming, and identifying trends was difficult.
I designed a central dashboard that brings this information into a single database and presents it through real-time charts and key metrics. The team can monitor results, assess the performance of individual streams, and use these insights to inform content planning.
View all live streaming data in one place.
Analyze viewership and engagement in real time.
Compare results by doctor, host, and content type.
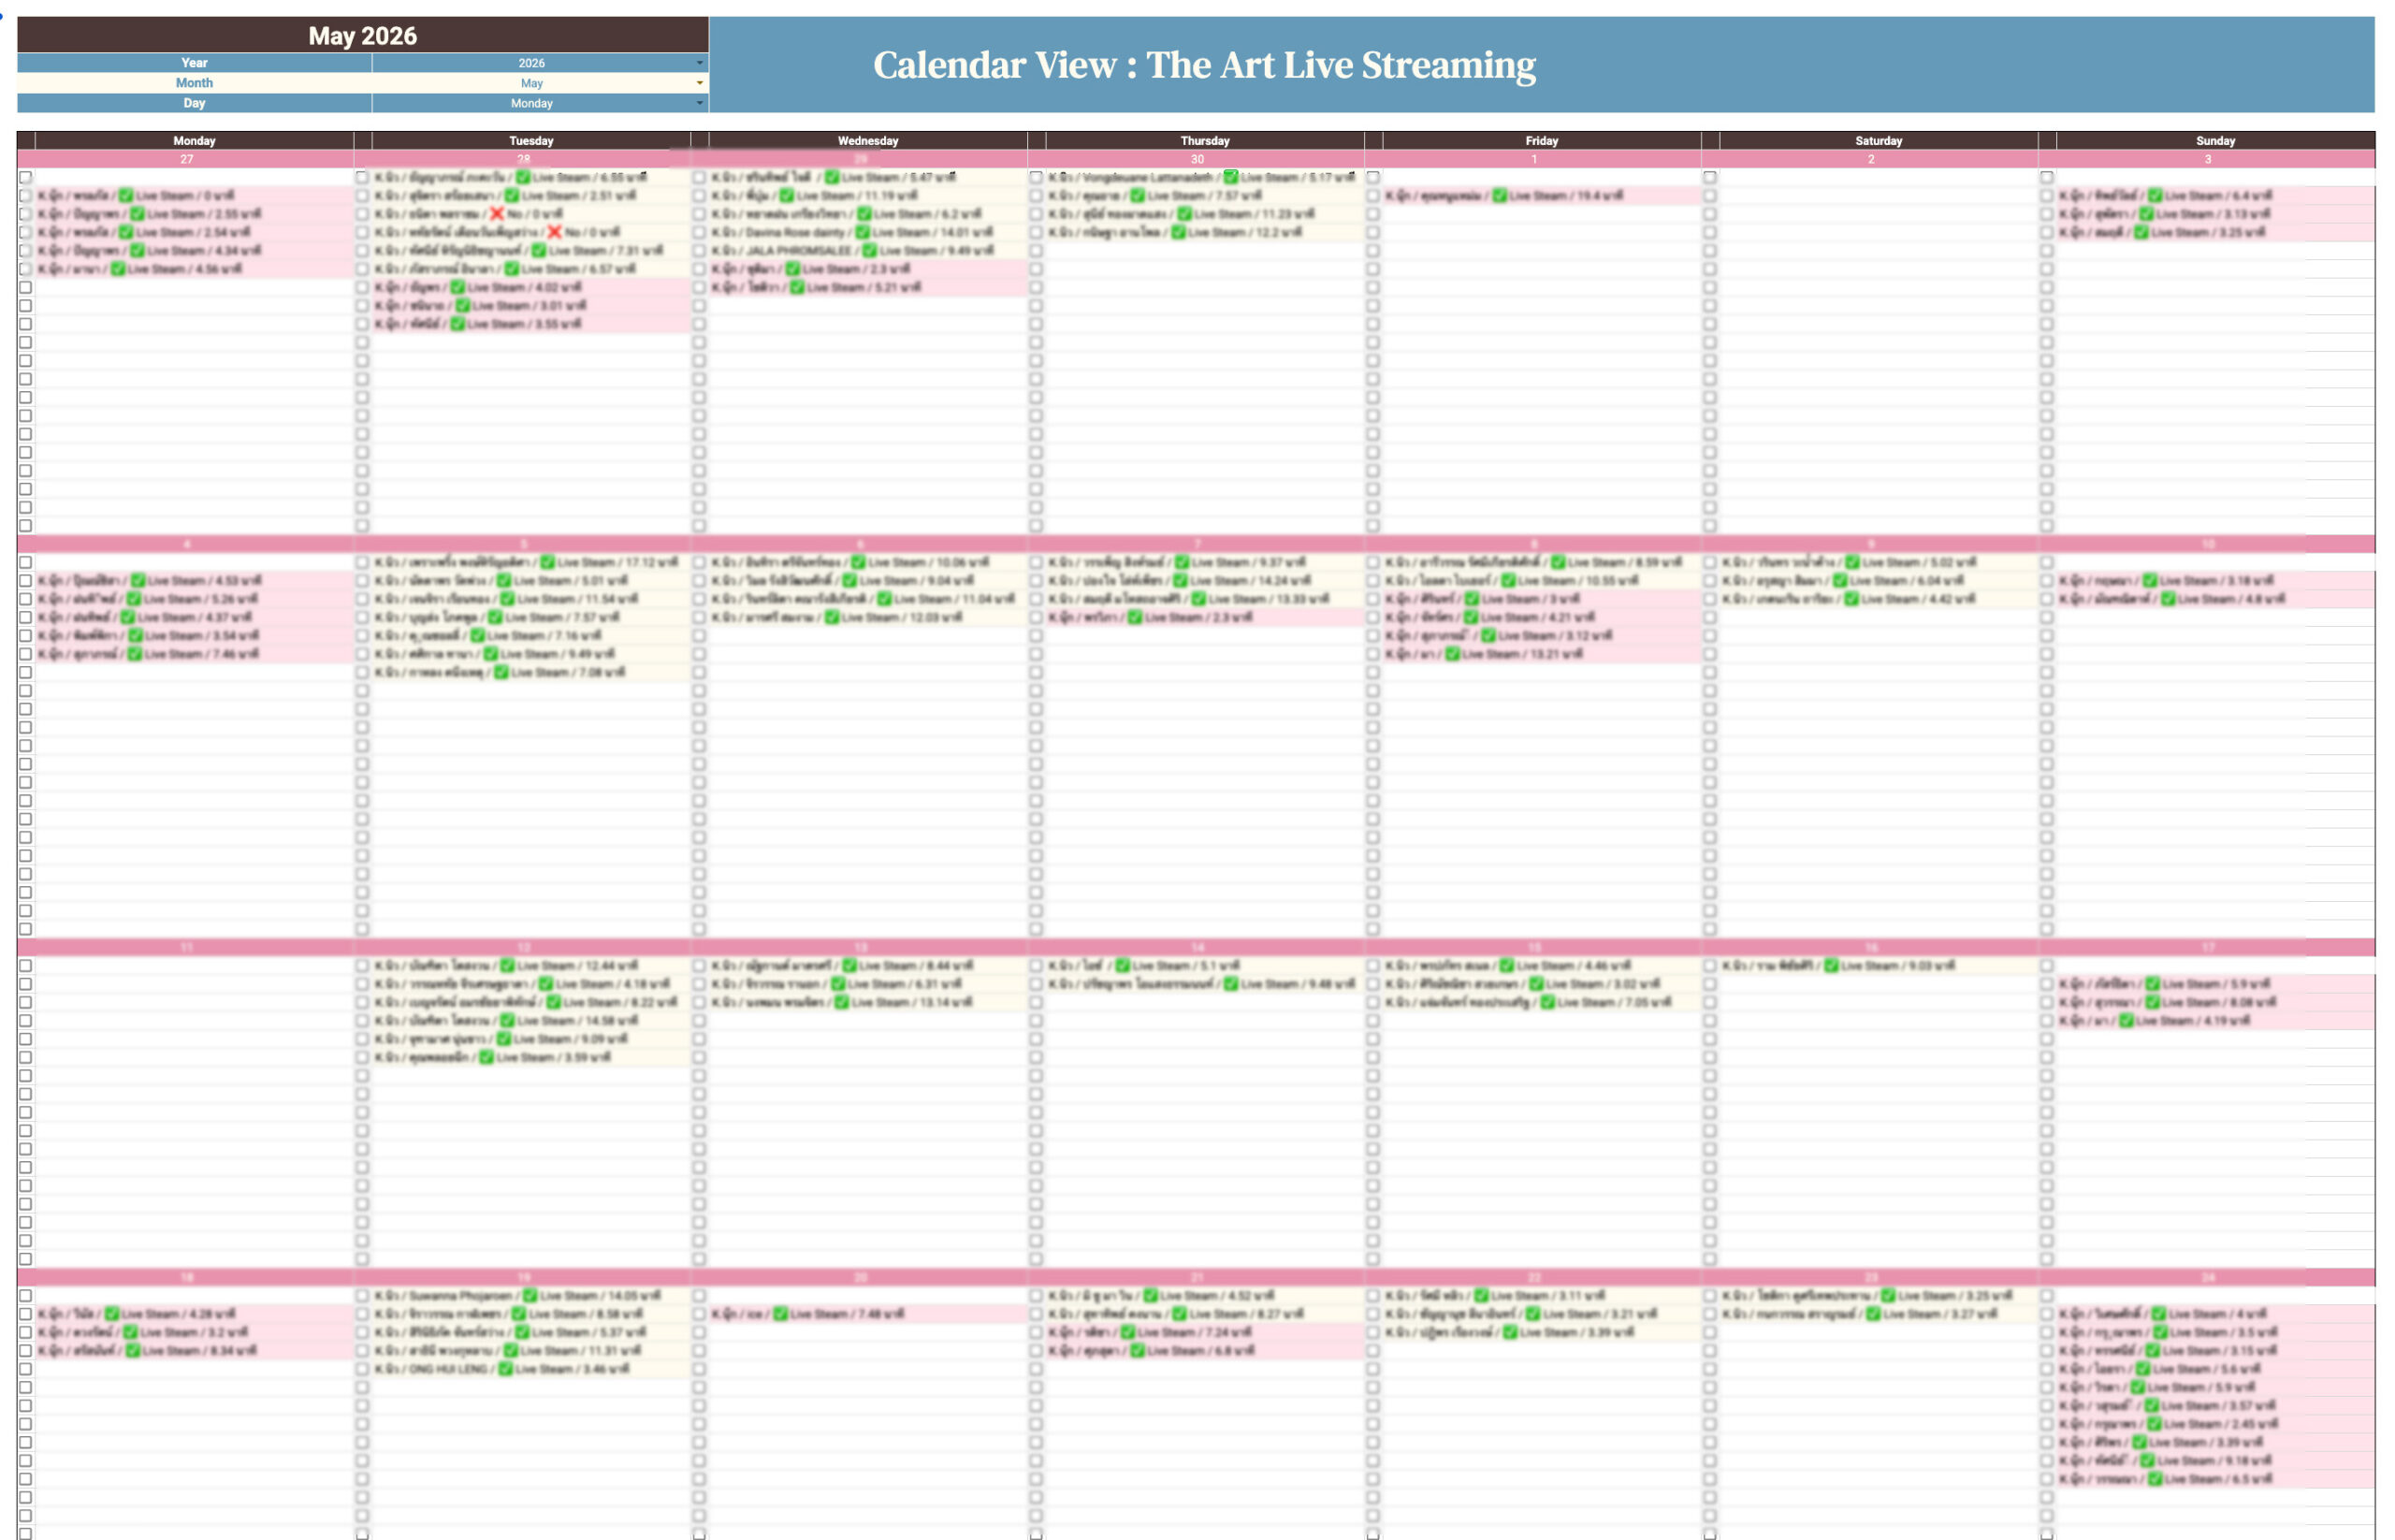
I designed a calendar view that automatically pulls information from each live branding team member’s work log. When they record stream details, such as the date, doctor, case, person responsible, duration, and status, the information appears on the calendar immediately.
This gives the team a clear daily and monthly overview without having to re-enter information in a separate calendar.
Automatically sync individual work entries with the calendar.
Eliminate duplicate data entry across multiple pages.
See which streams are scheduled and who is responsible.
Monitor team schedules and workloads in real time.
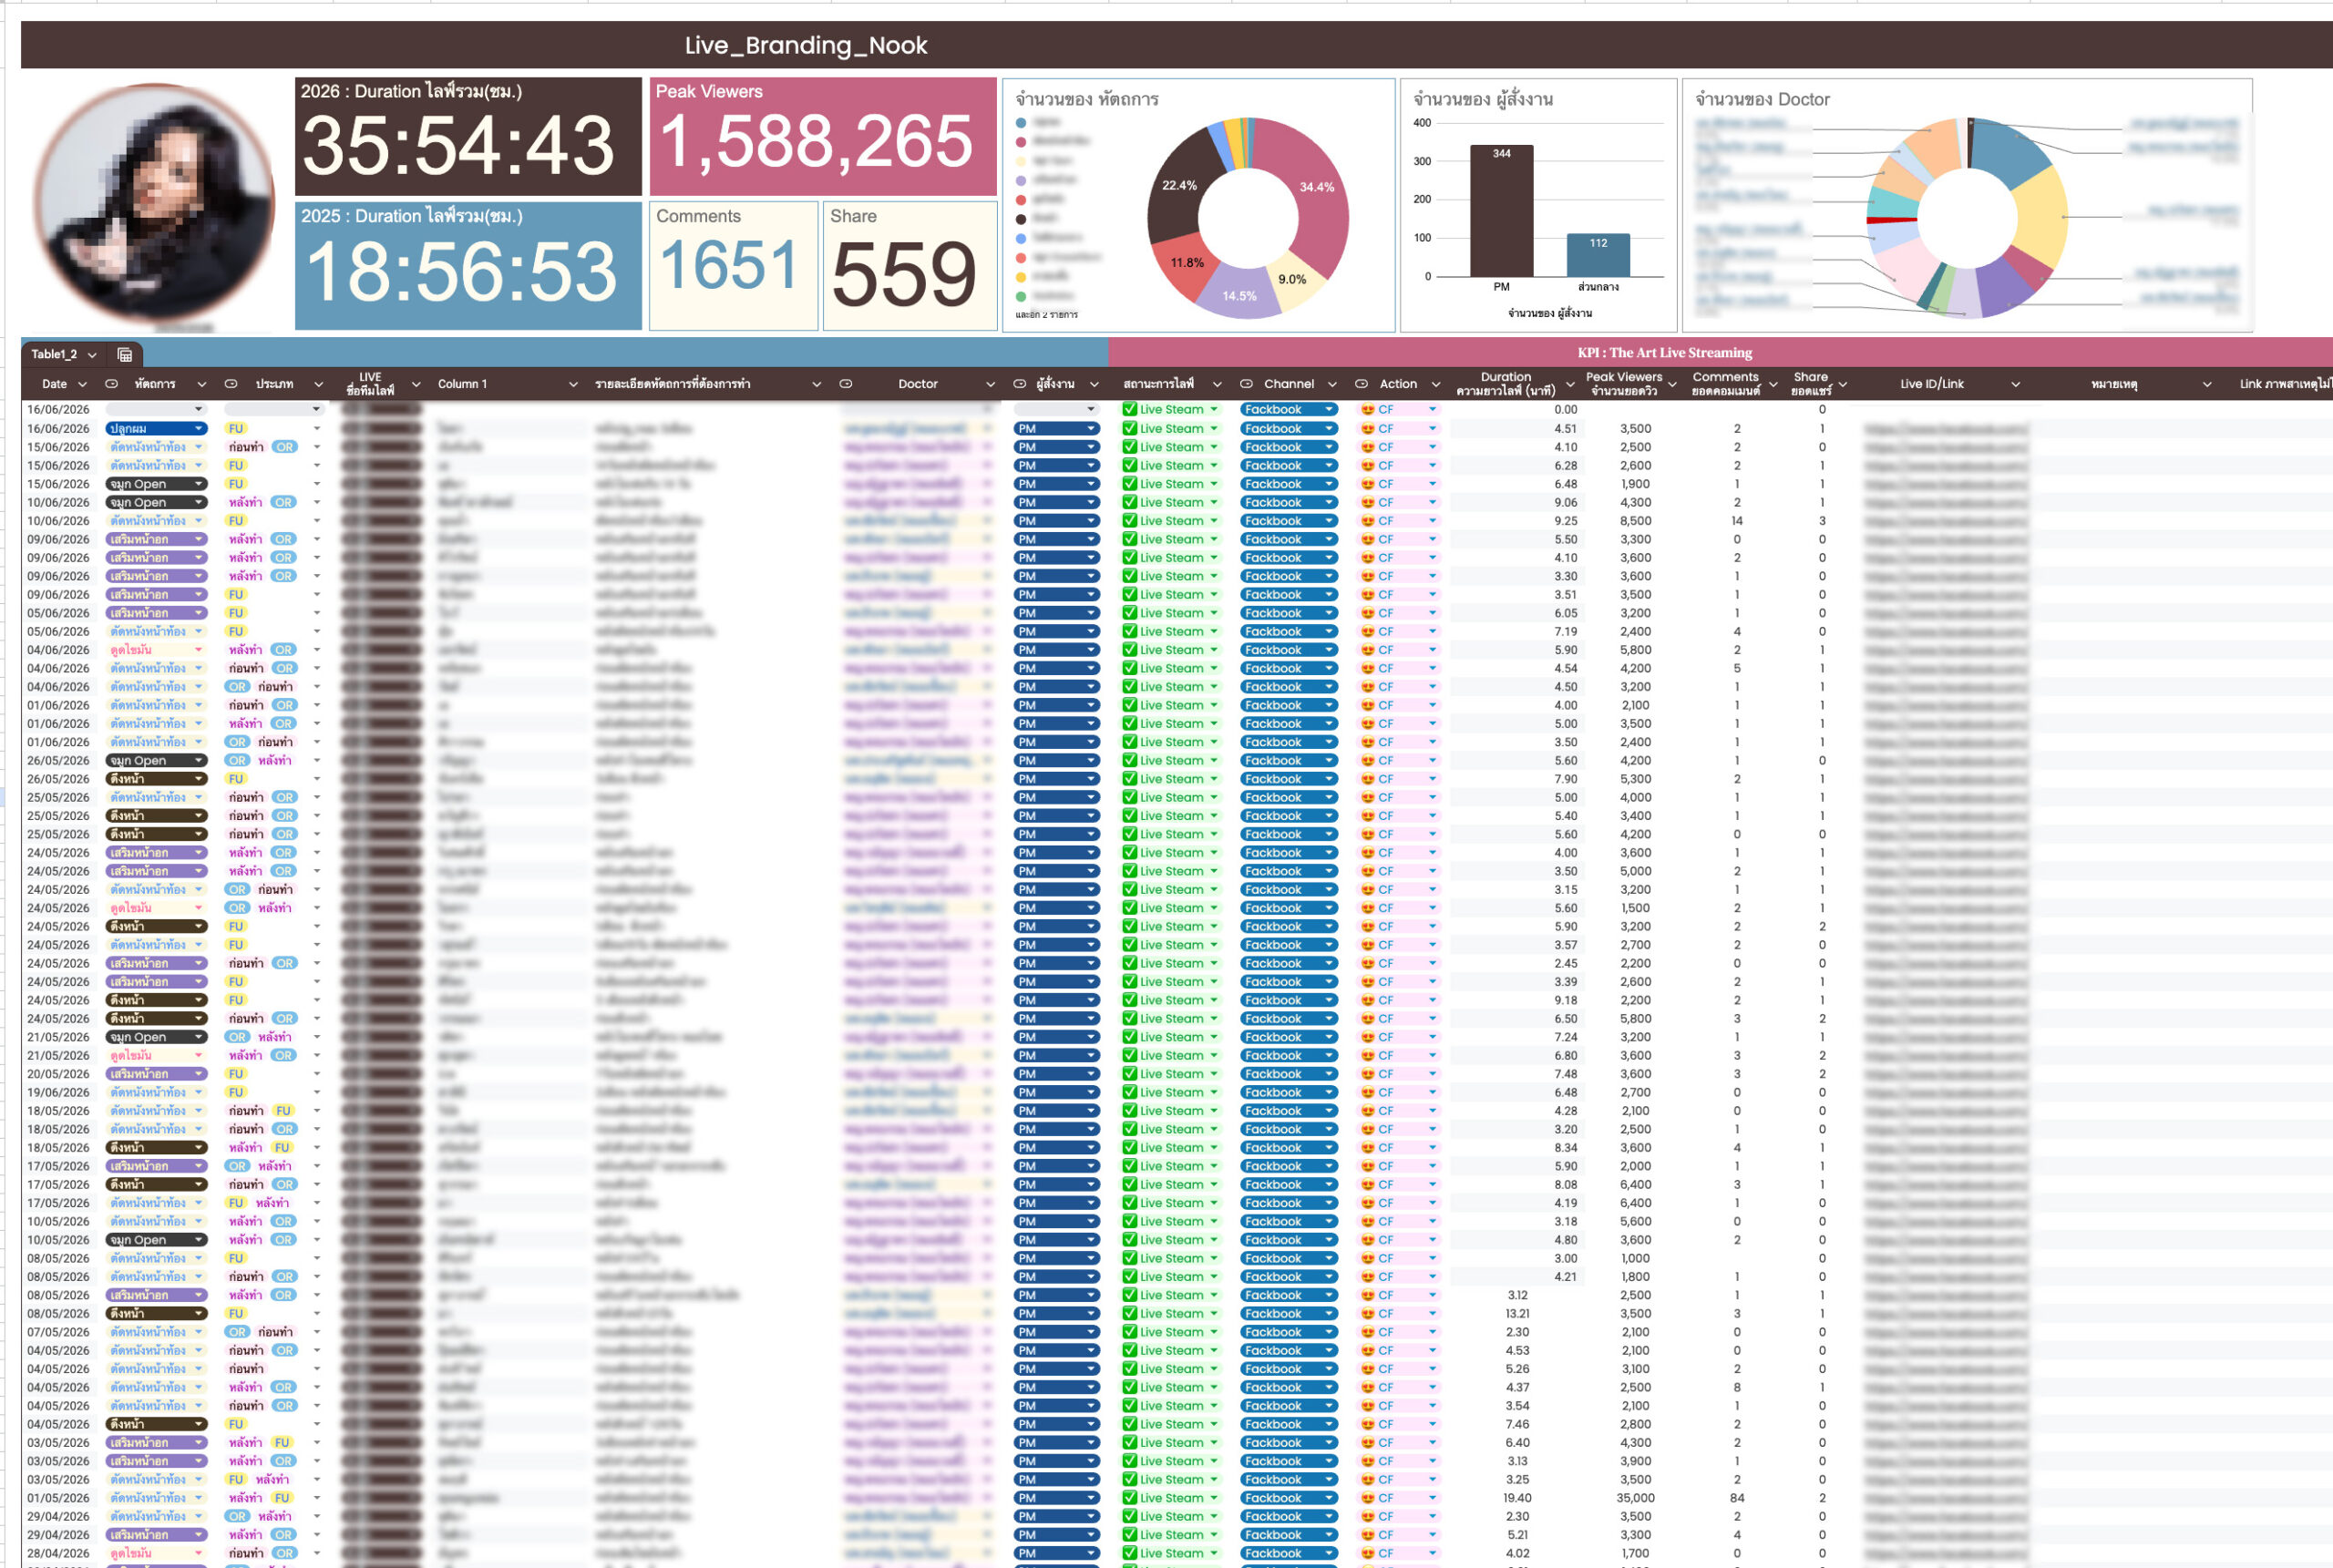
I designed this system to track each team member’s performance individually. Live streaming records stored in the central database are automatically summarized in personal dashboards, showing streaming hours, peak viewers, comments, shares, and all streams managed by that person.
This provides a transparent, evidence-based approach to performance tracking and evaluation.
Track individual performance in real time.
Generate KPI and performance summaries automatically.
Reduce the work involved in preparing monthly reports.
Support performance reviews with recorded results.
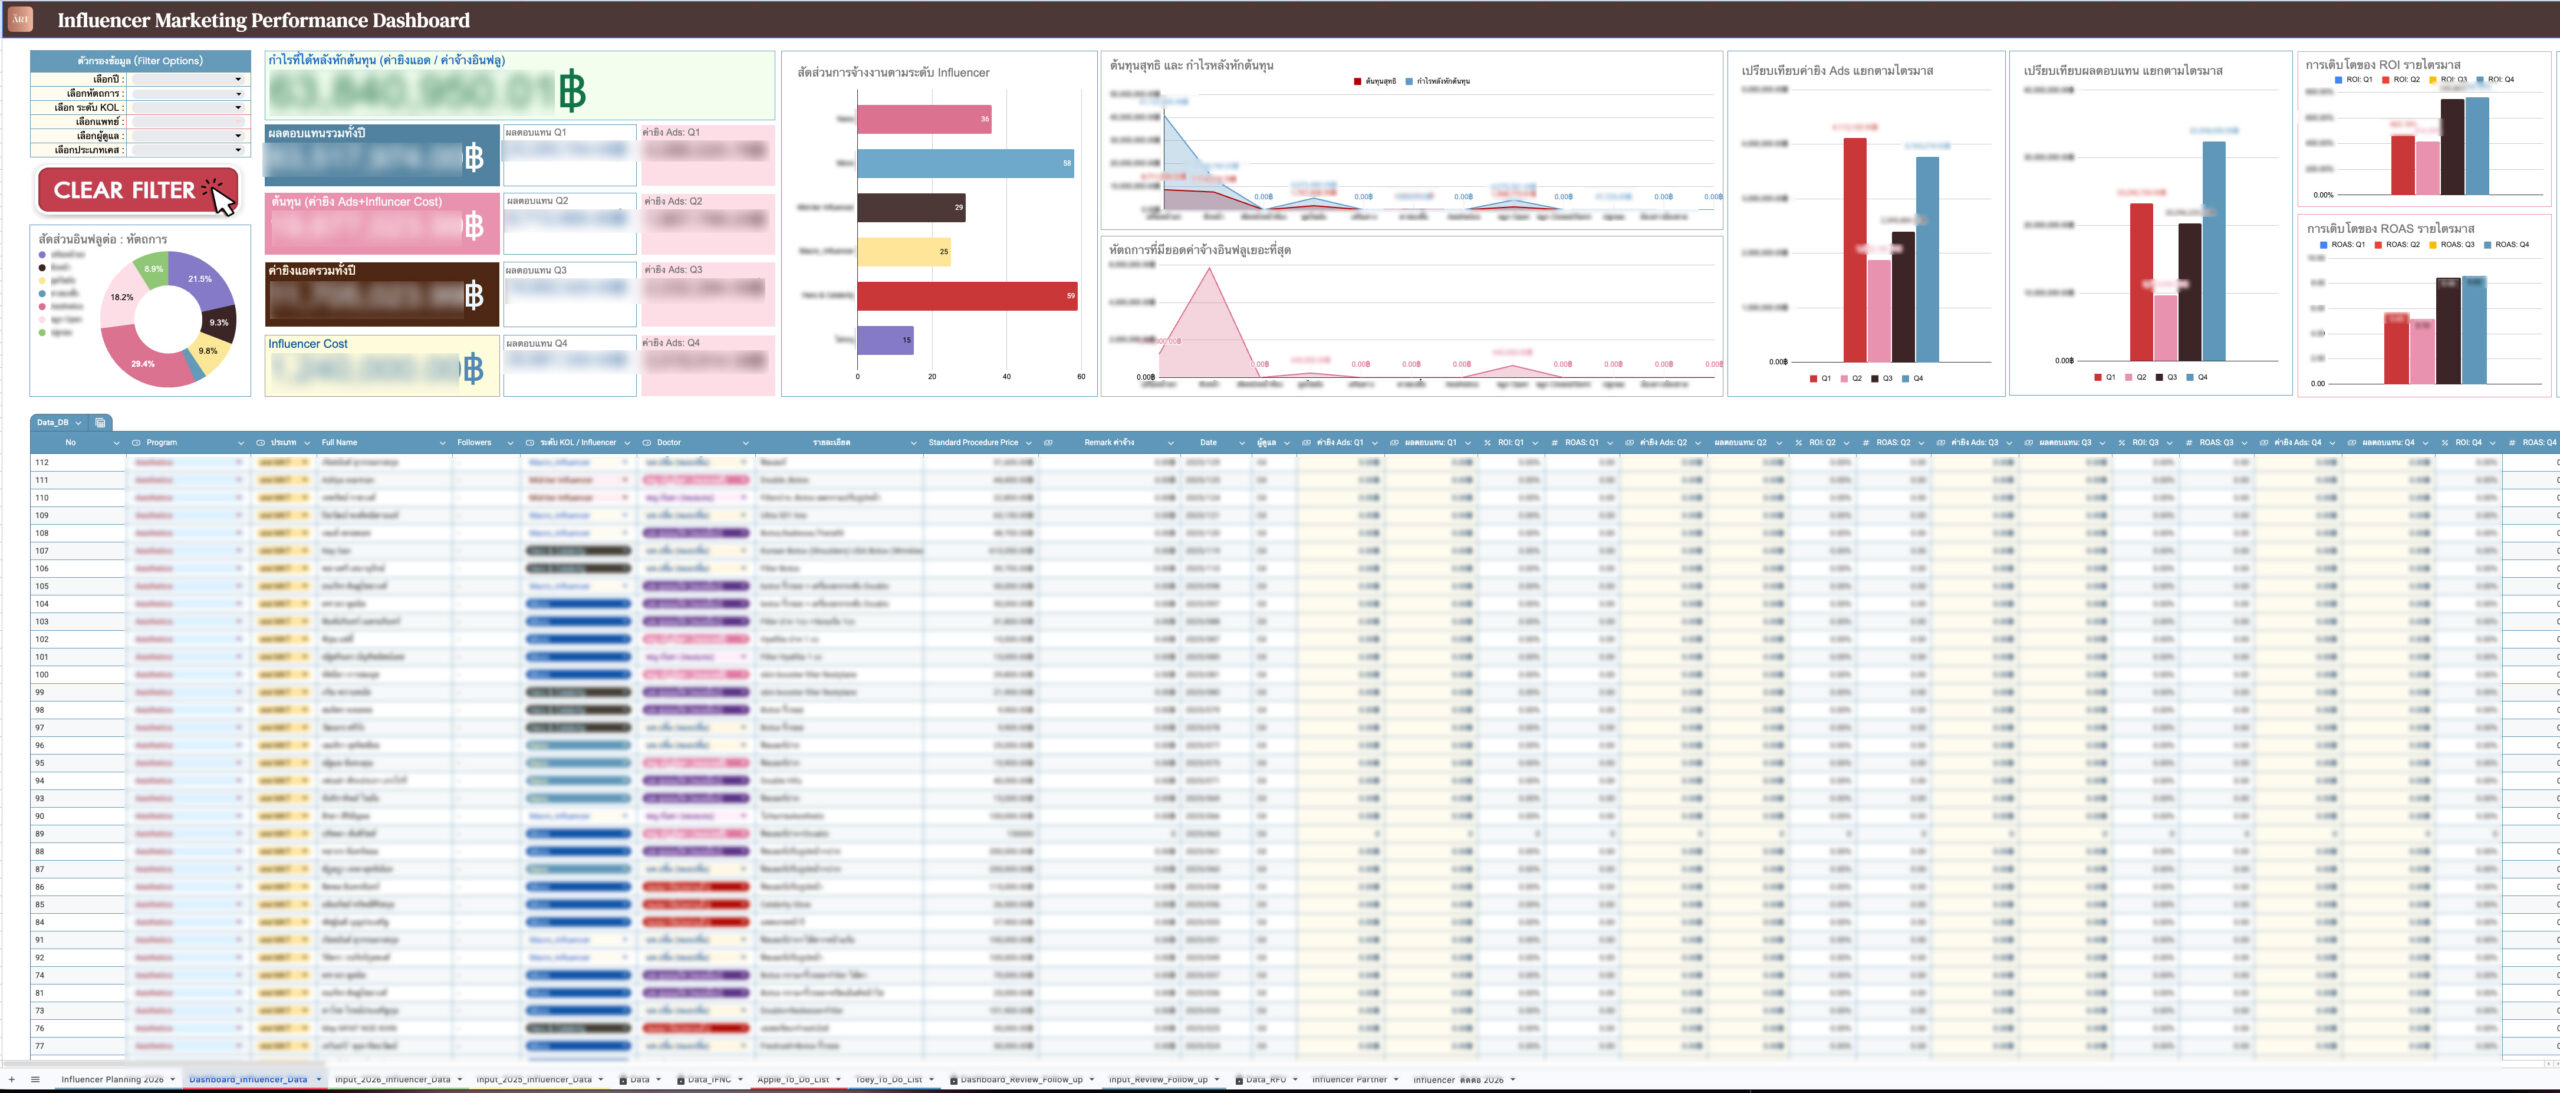
With influencer records stored in a central database, I developed a dashboard that automatically brings together revenue, costs, influencer fees, and advertising spend.
The system calculates and summarizes campaign results in real time, including revenue, profit, ROI, and ROAS. Users can compare performance by procedure, doctor, or influencer tier, helping the team base marketing decisions on recorded results rather than assumptions.
Analyze influencer revenue, costs, and returns in real time.
Calculate ROI and ROAS automatically to simplify reporting.
Compare performance across campaigns and procedures.
Support data-driven budgeting and marketing strategy.
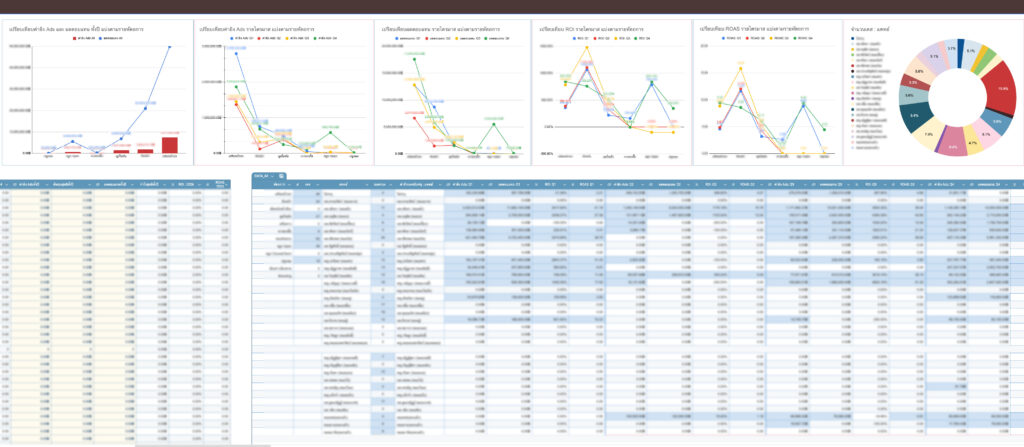
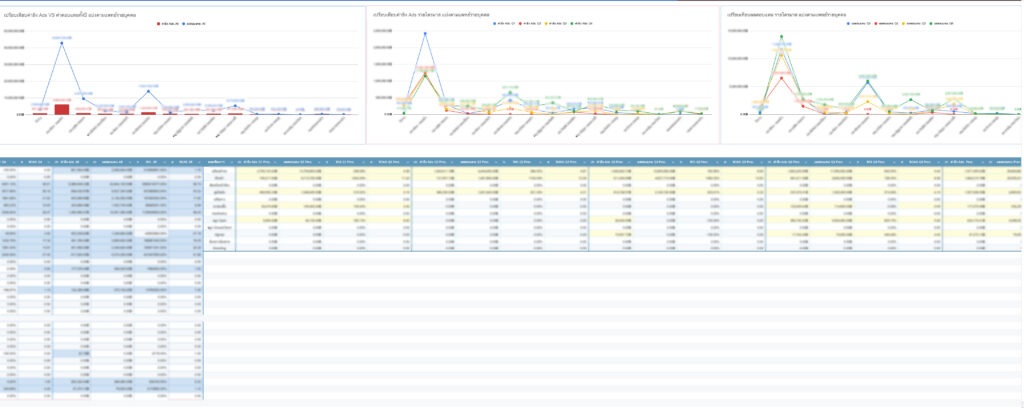
Influencer marketing plans were previously spread across multiple files, making it difficult to check whether spending and influencer numbers were on target for each procedure.
I designed a planning dashboard that brings all plans into one place. Annual targets are organized by procedure, influencer tier, budget, and doctor, with progress tracked against those targets in real time. This helps the team plan budgets and resources more effectively.
View targets and results for each procedure in one place.
Plan influencer numbers by tier and budget.
Track progress against annual targets in real time.
Use data to guide influencer marketing strategy.
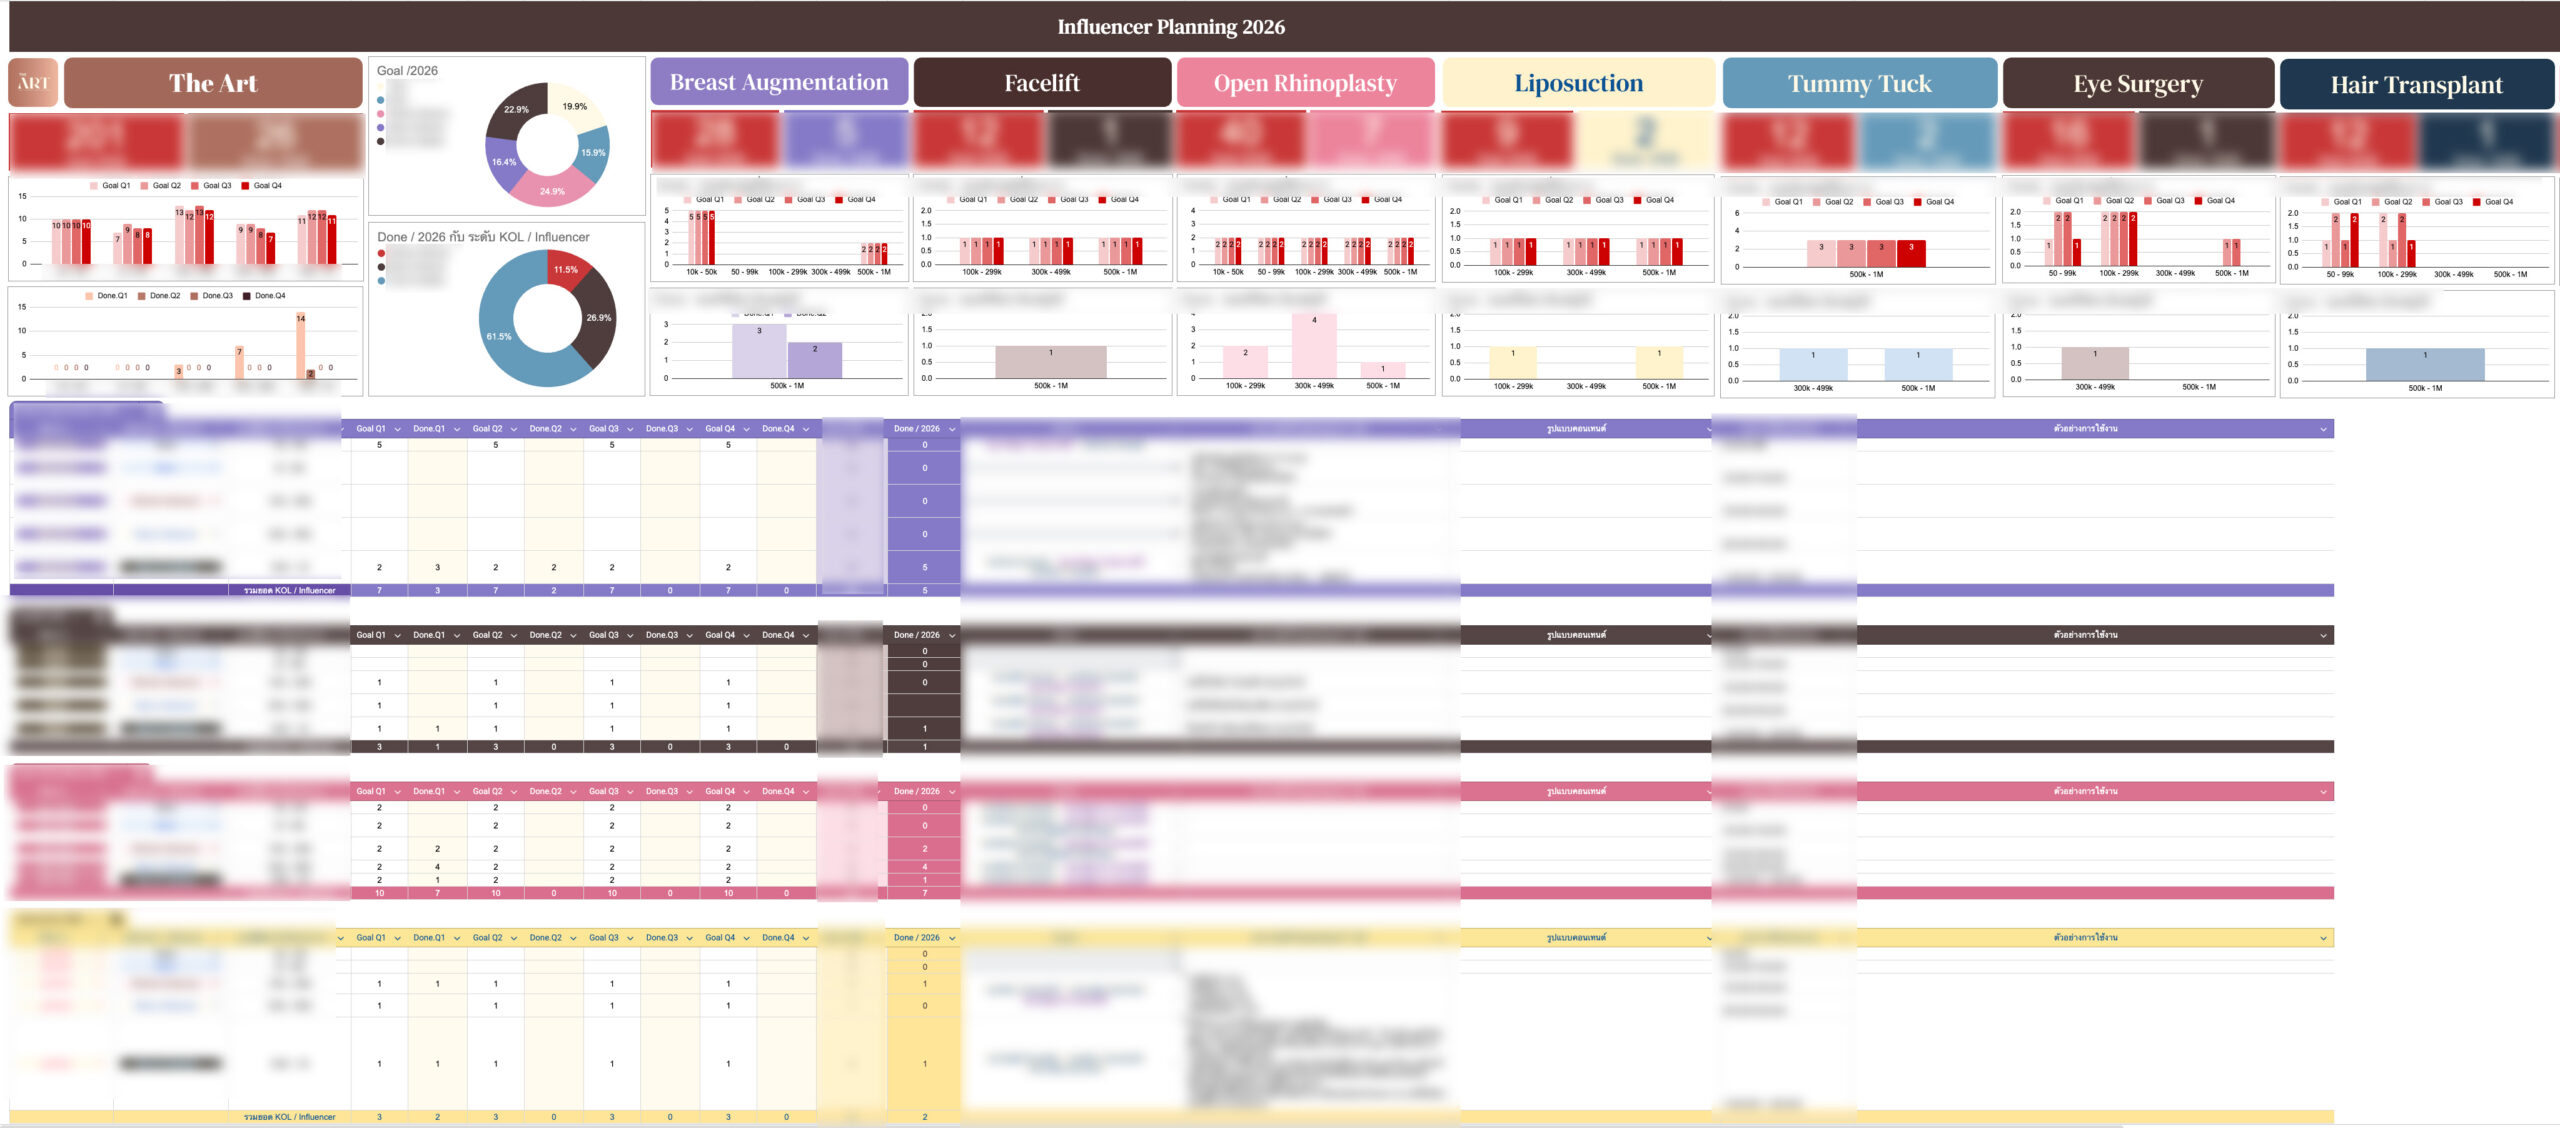
Influencer information was previously stored in different formats, making it difficult to search records and analyze past performance.
I designed a central database that brings together key information, including follower counts, assigned doctors, budgets, revenue, quarterly results, and individual influencer performance. The database connects directly to dashboards and automated reports, creating a consistent approach to data management across the organization.
Store influencer information in a single database.
Feed data into dashboards automatically.
Review historical results quickly.
Reduce duplicate records and data errors.
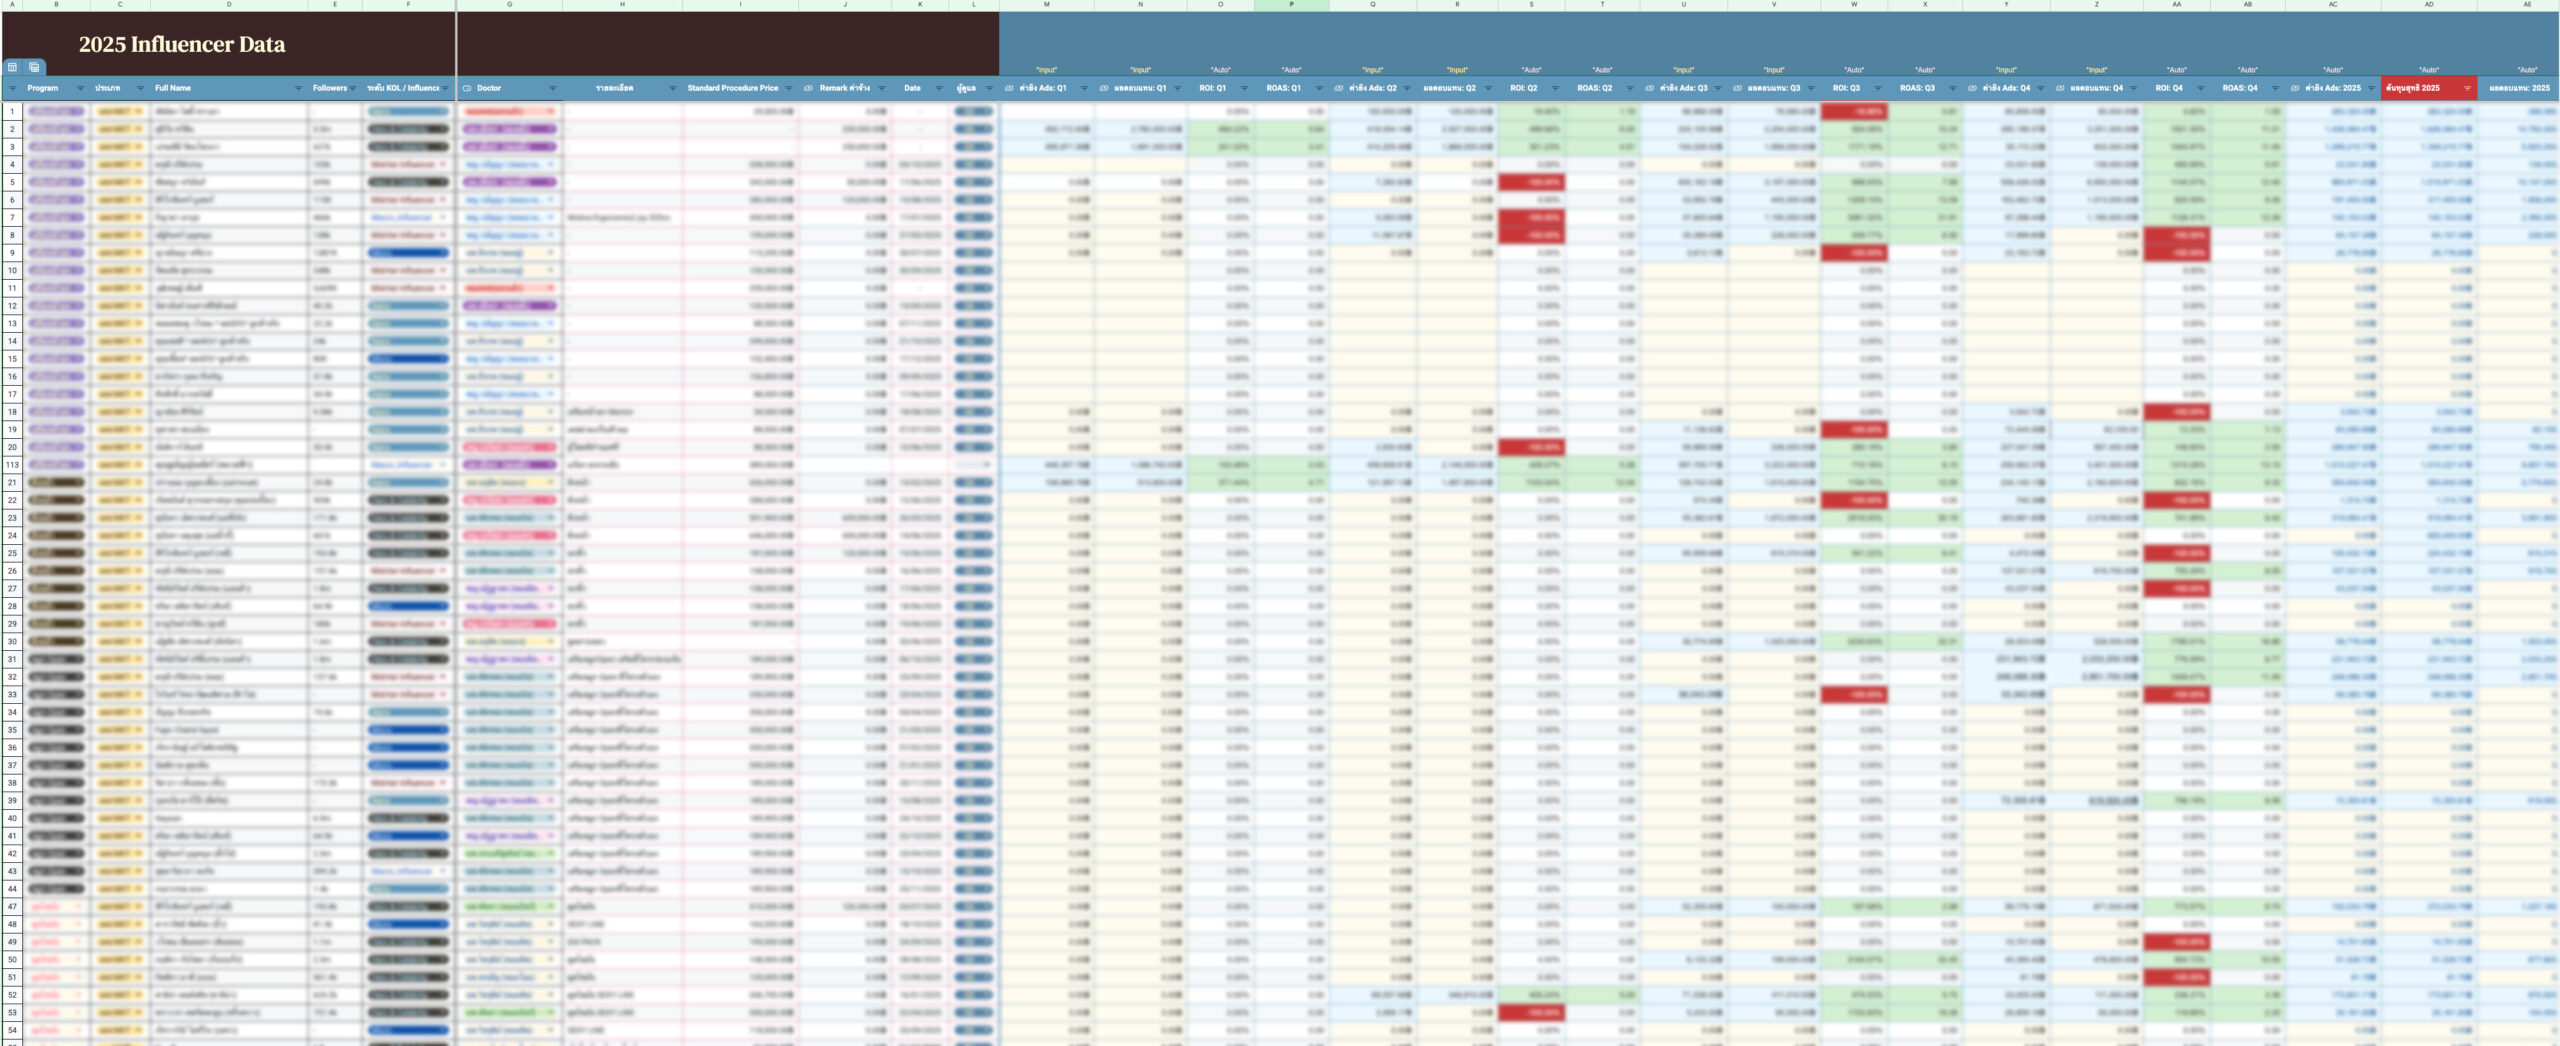
I developed a to-do list system that allows the team to record and track influencer-related tasks in one place. Activities such as outreach, scheduling, post reviews, content publishing, and follow-ups are saved to a central database and automatically summarized in a dashboard.
The team can view individual workloads, task volumes, and progress in real time, helping prevent missed tasks and improve team coordination.
Track all task statuses in one place.
Manage team workflows systematically.
Analyze individual task volumes and performance.
Use data to guide team and resource management.
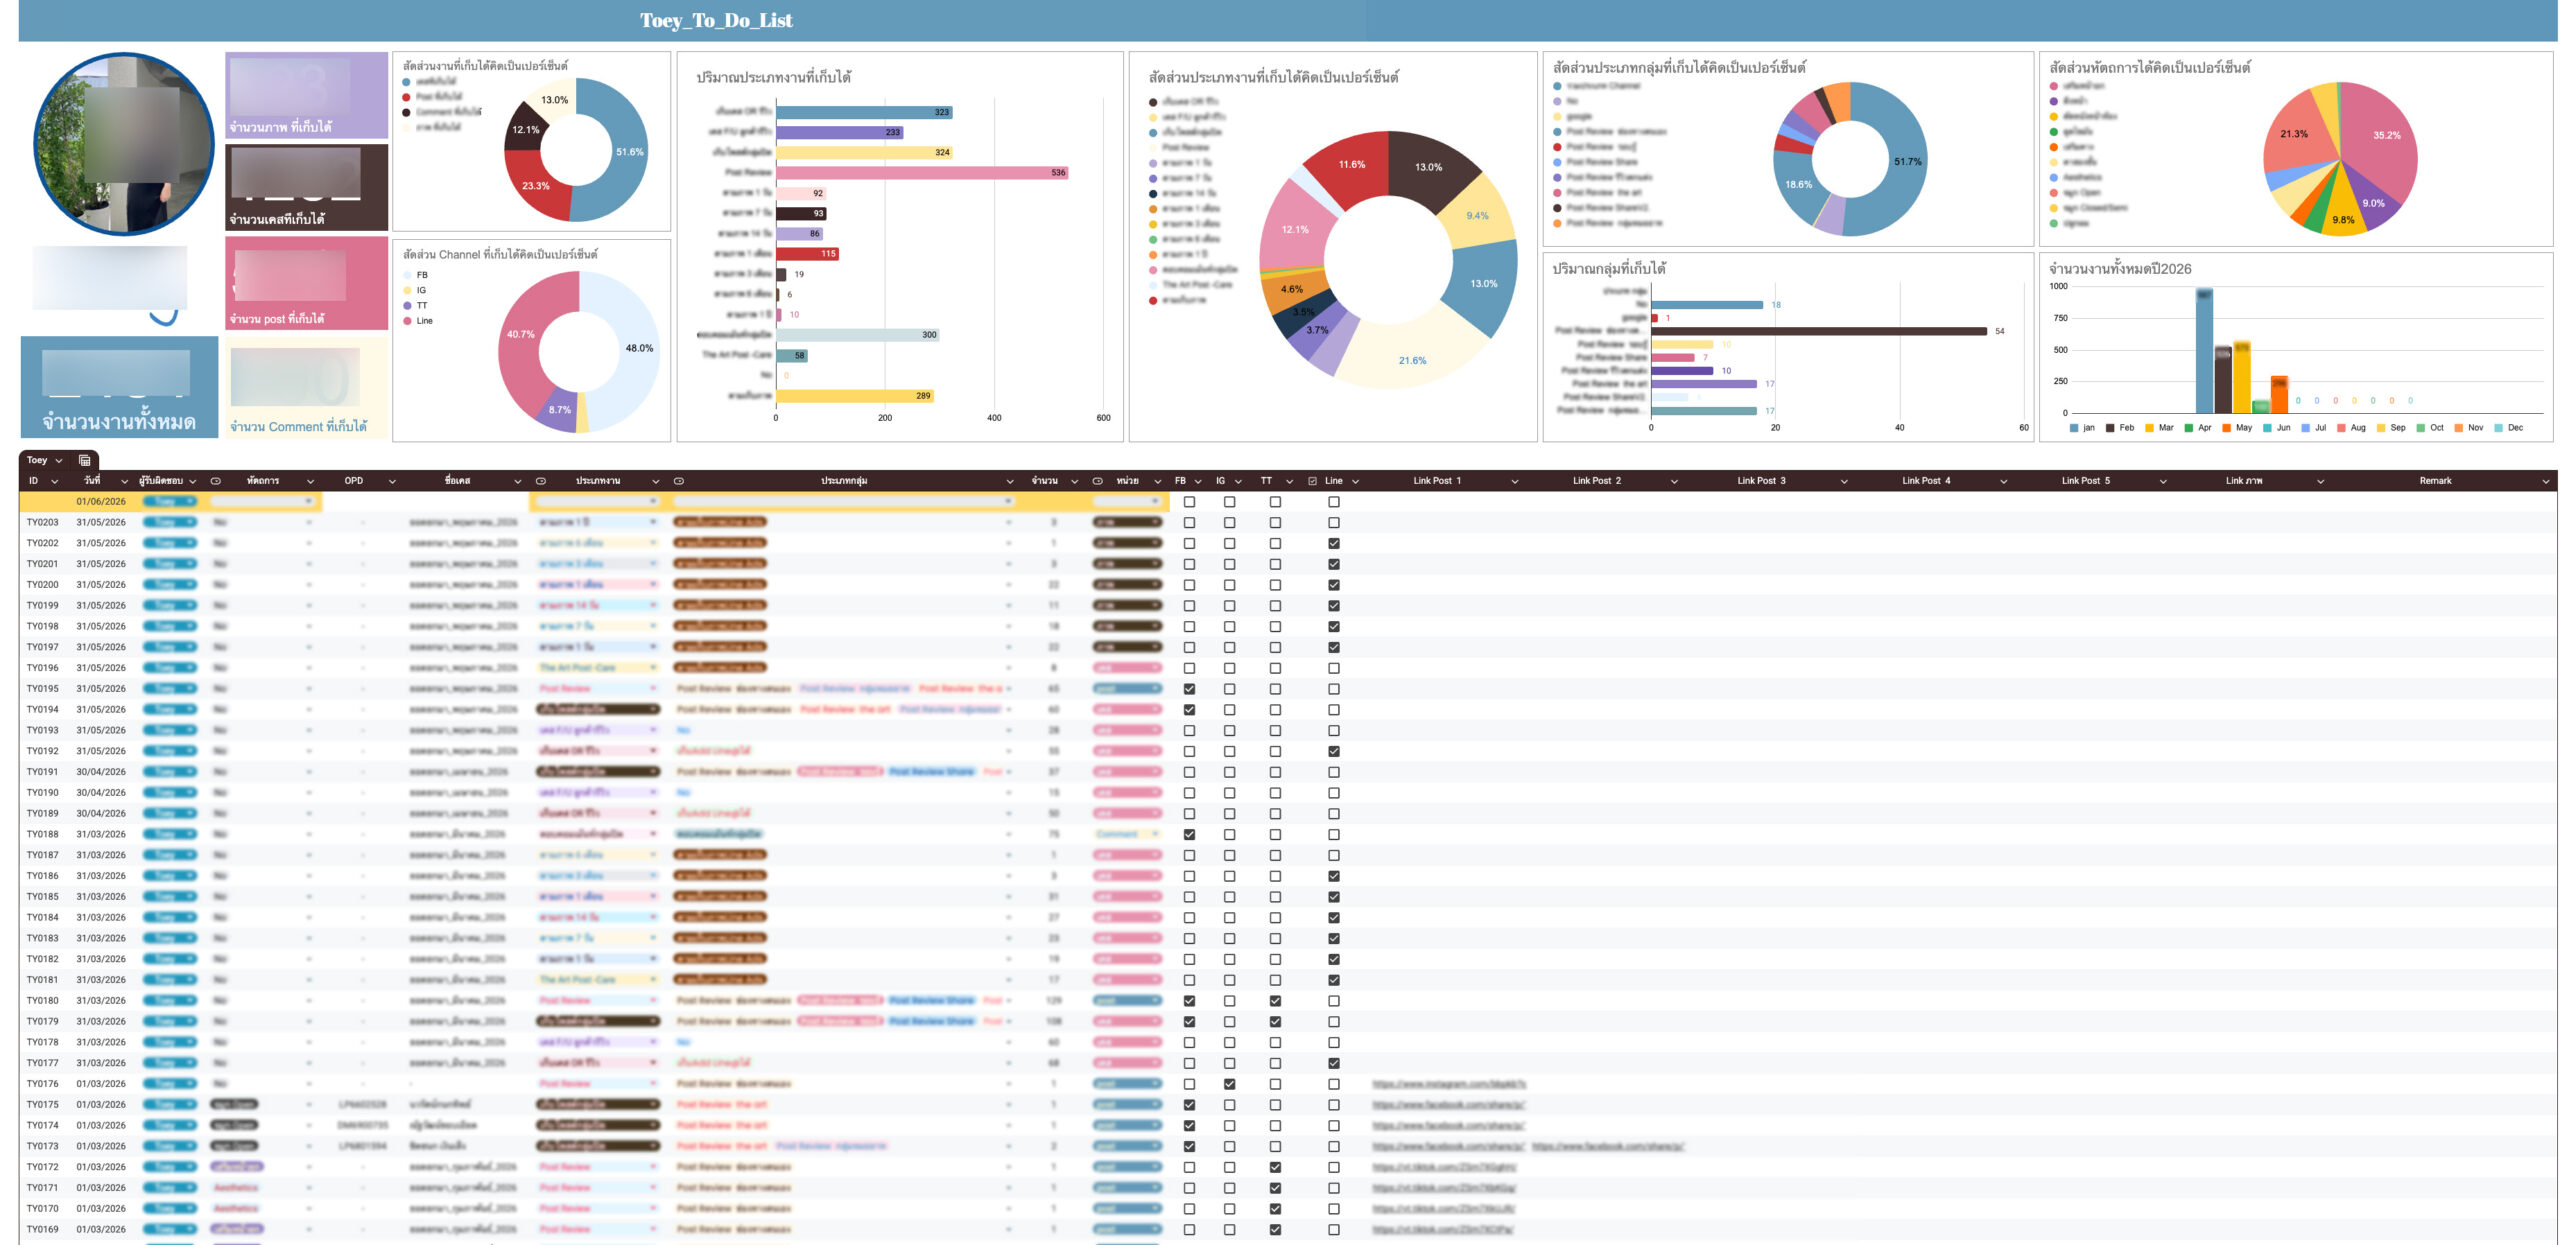
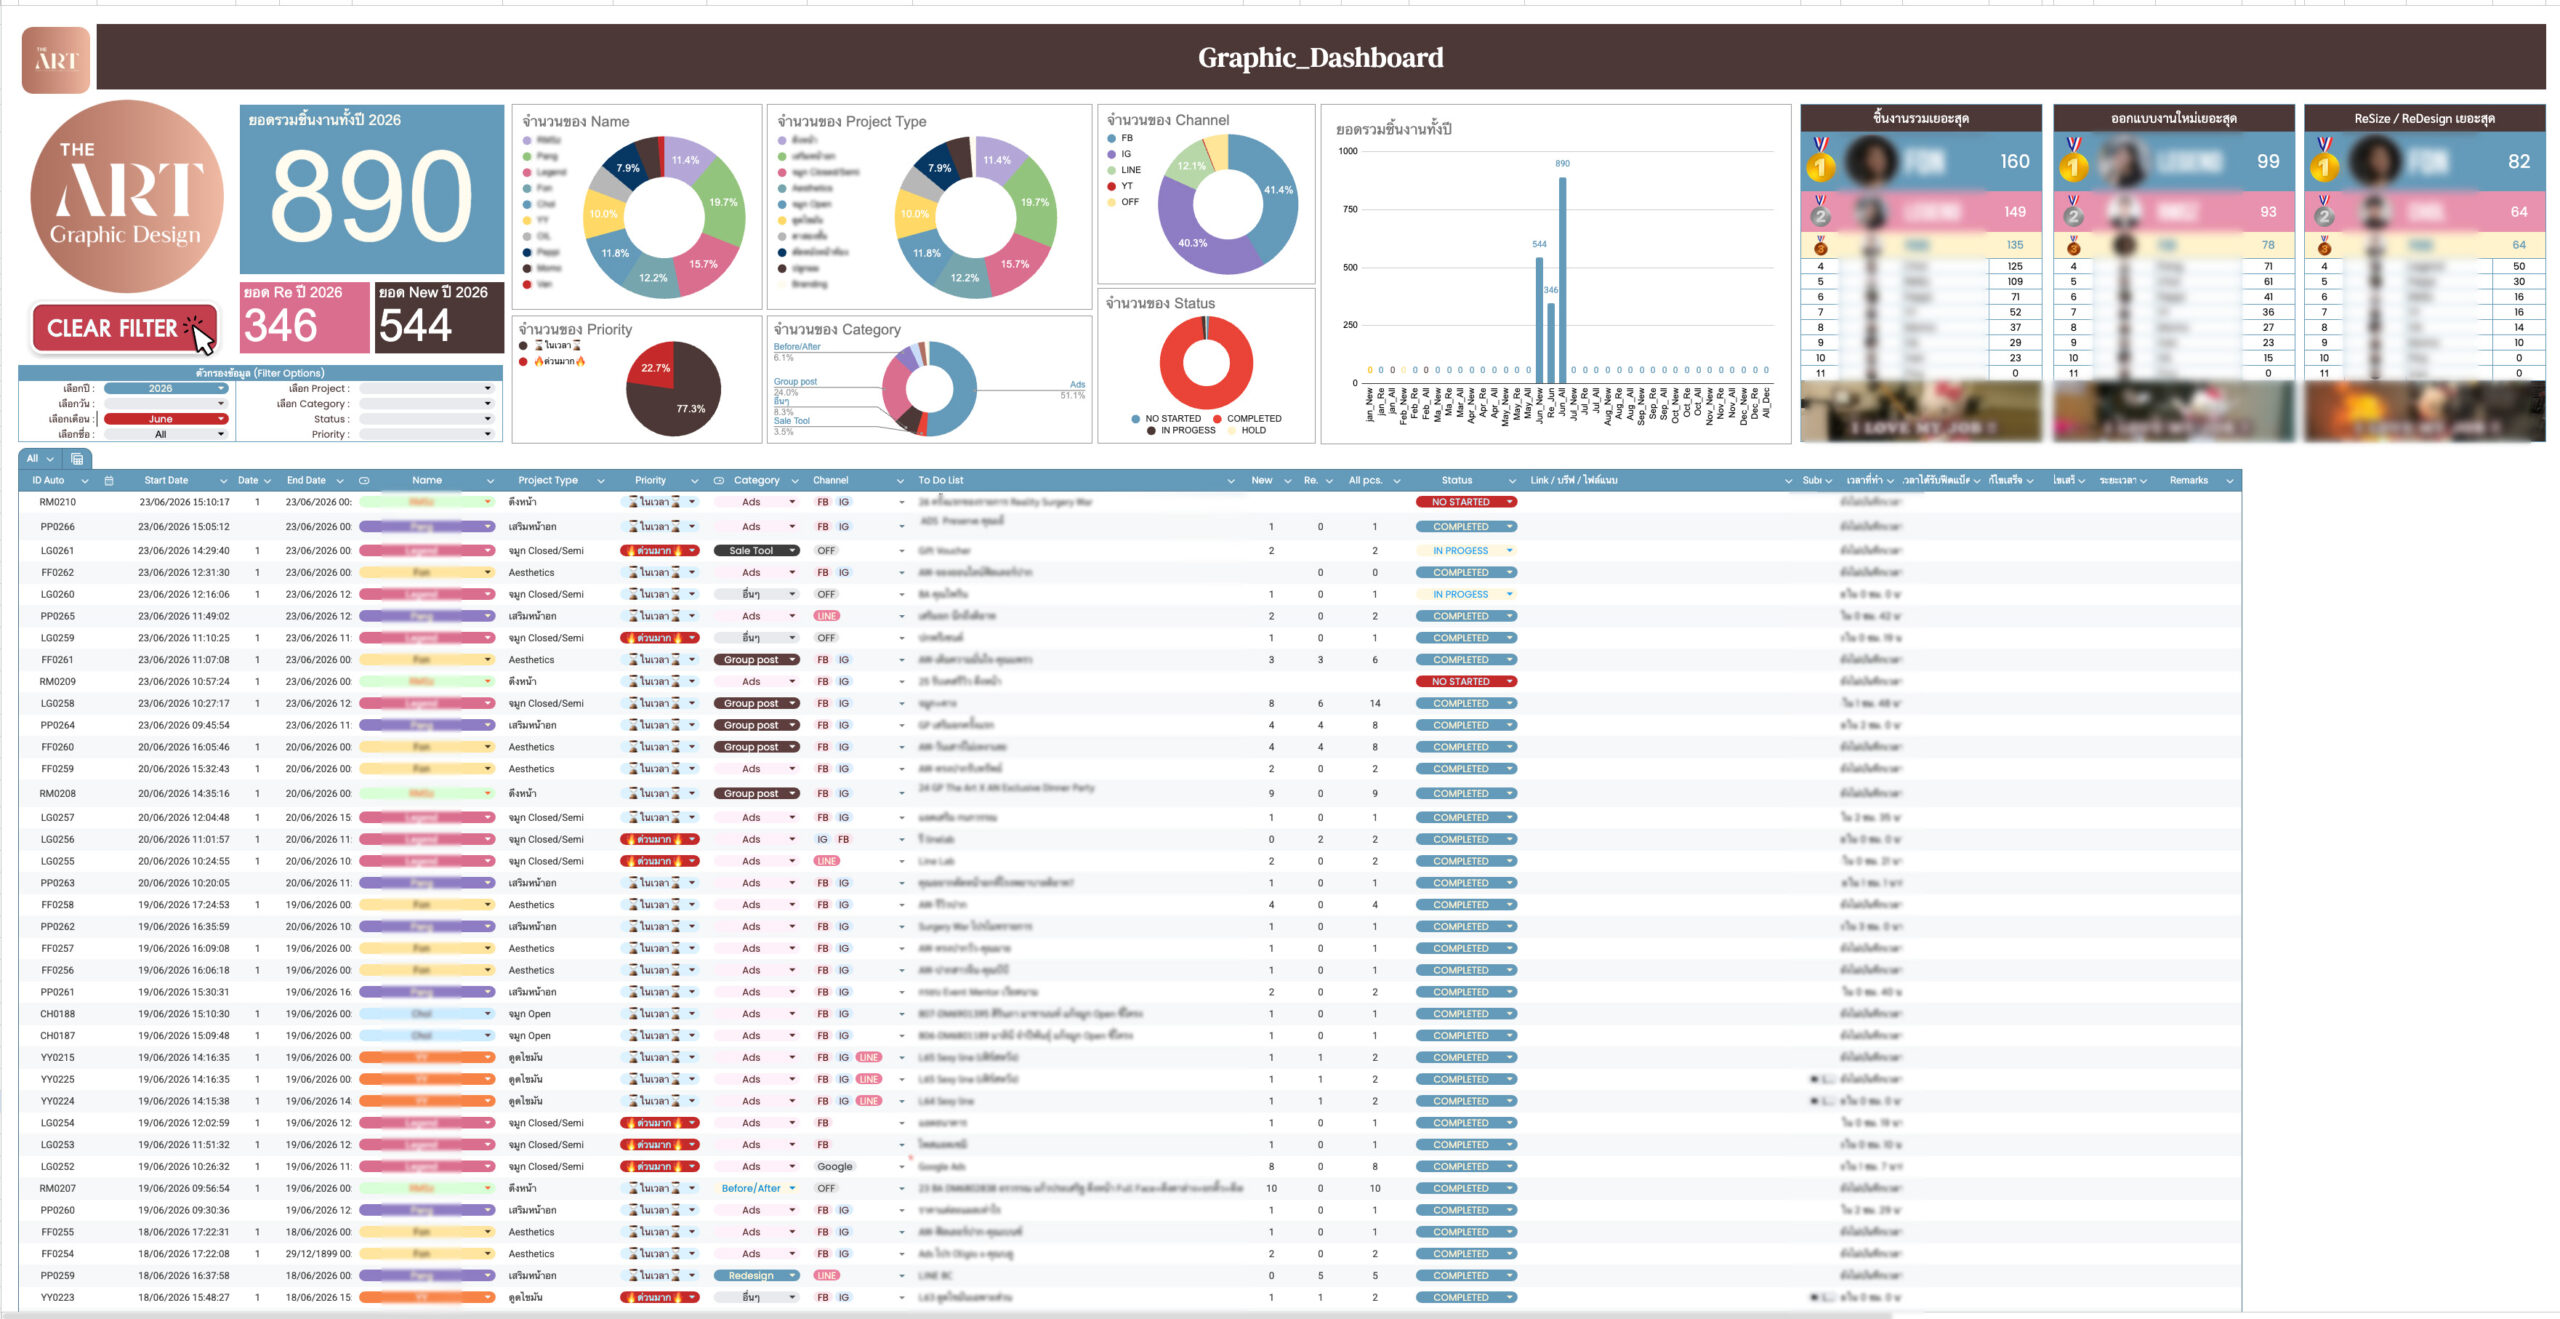
Tracking the graphic design team’s work previously meant checking chats, documents, and individual updates. This made it difficult to monitor task volumes and progress.
I designed a central dashboard that brings the team’s task entries into a single database and presents real-time charts, reports, and KPIs. It provides an overview of new design tasks, redesign requests, deliverable counts, and individual workloads in one place.
View the entire team’s work in one place.
Track new design tasks and redesign requests in real time.
Gain a clear view of individual workloads and productivity
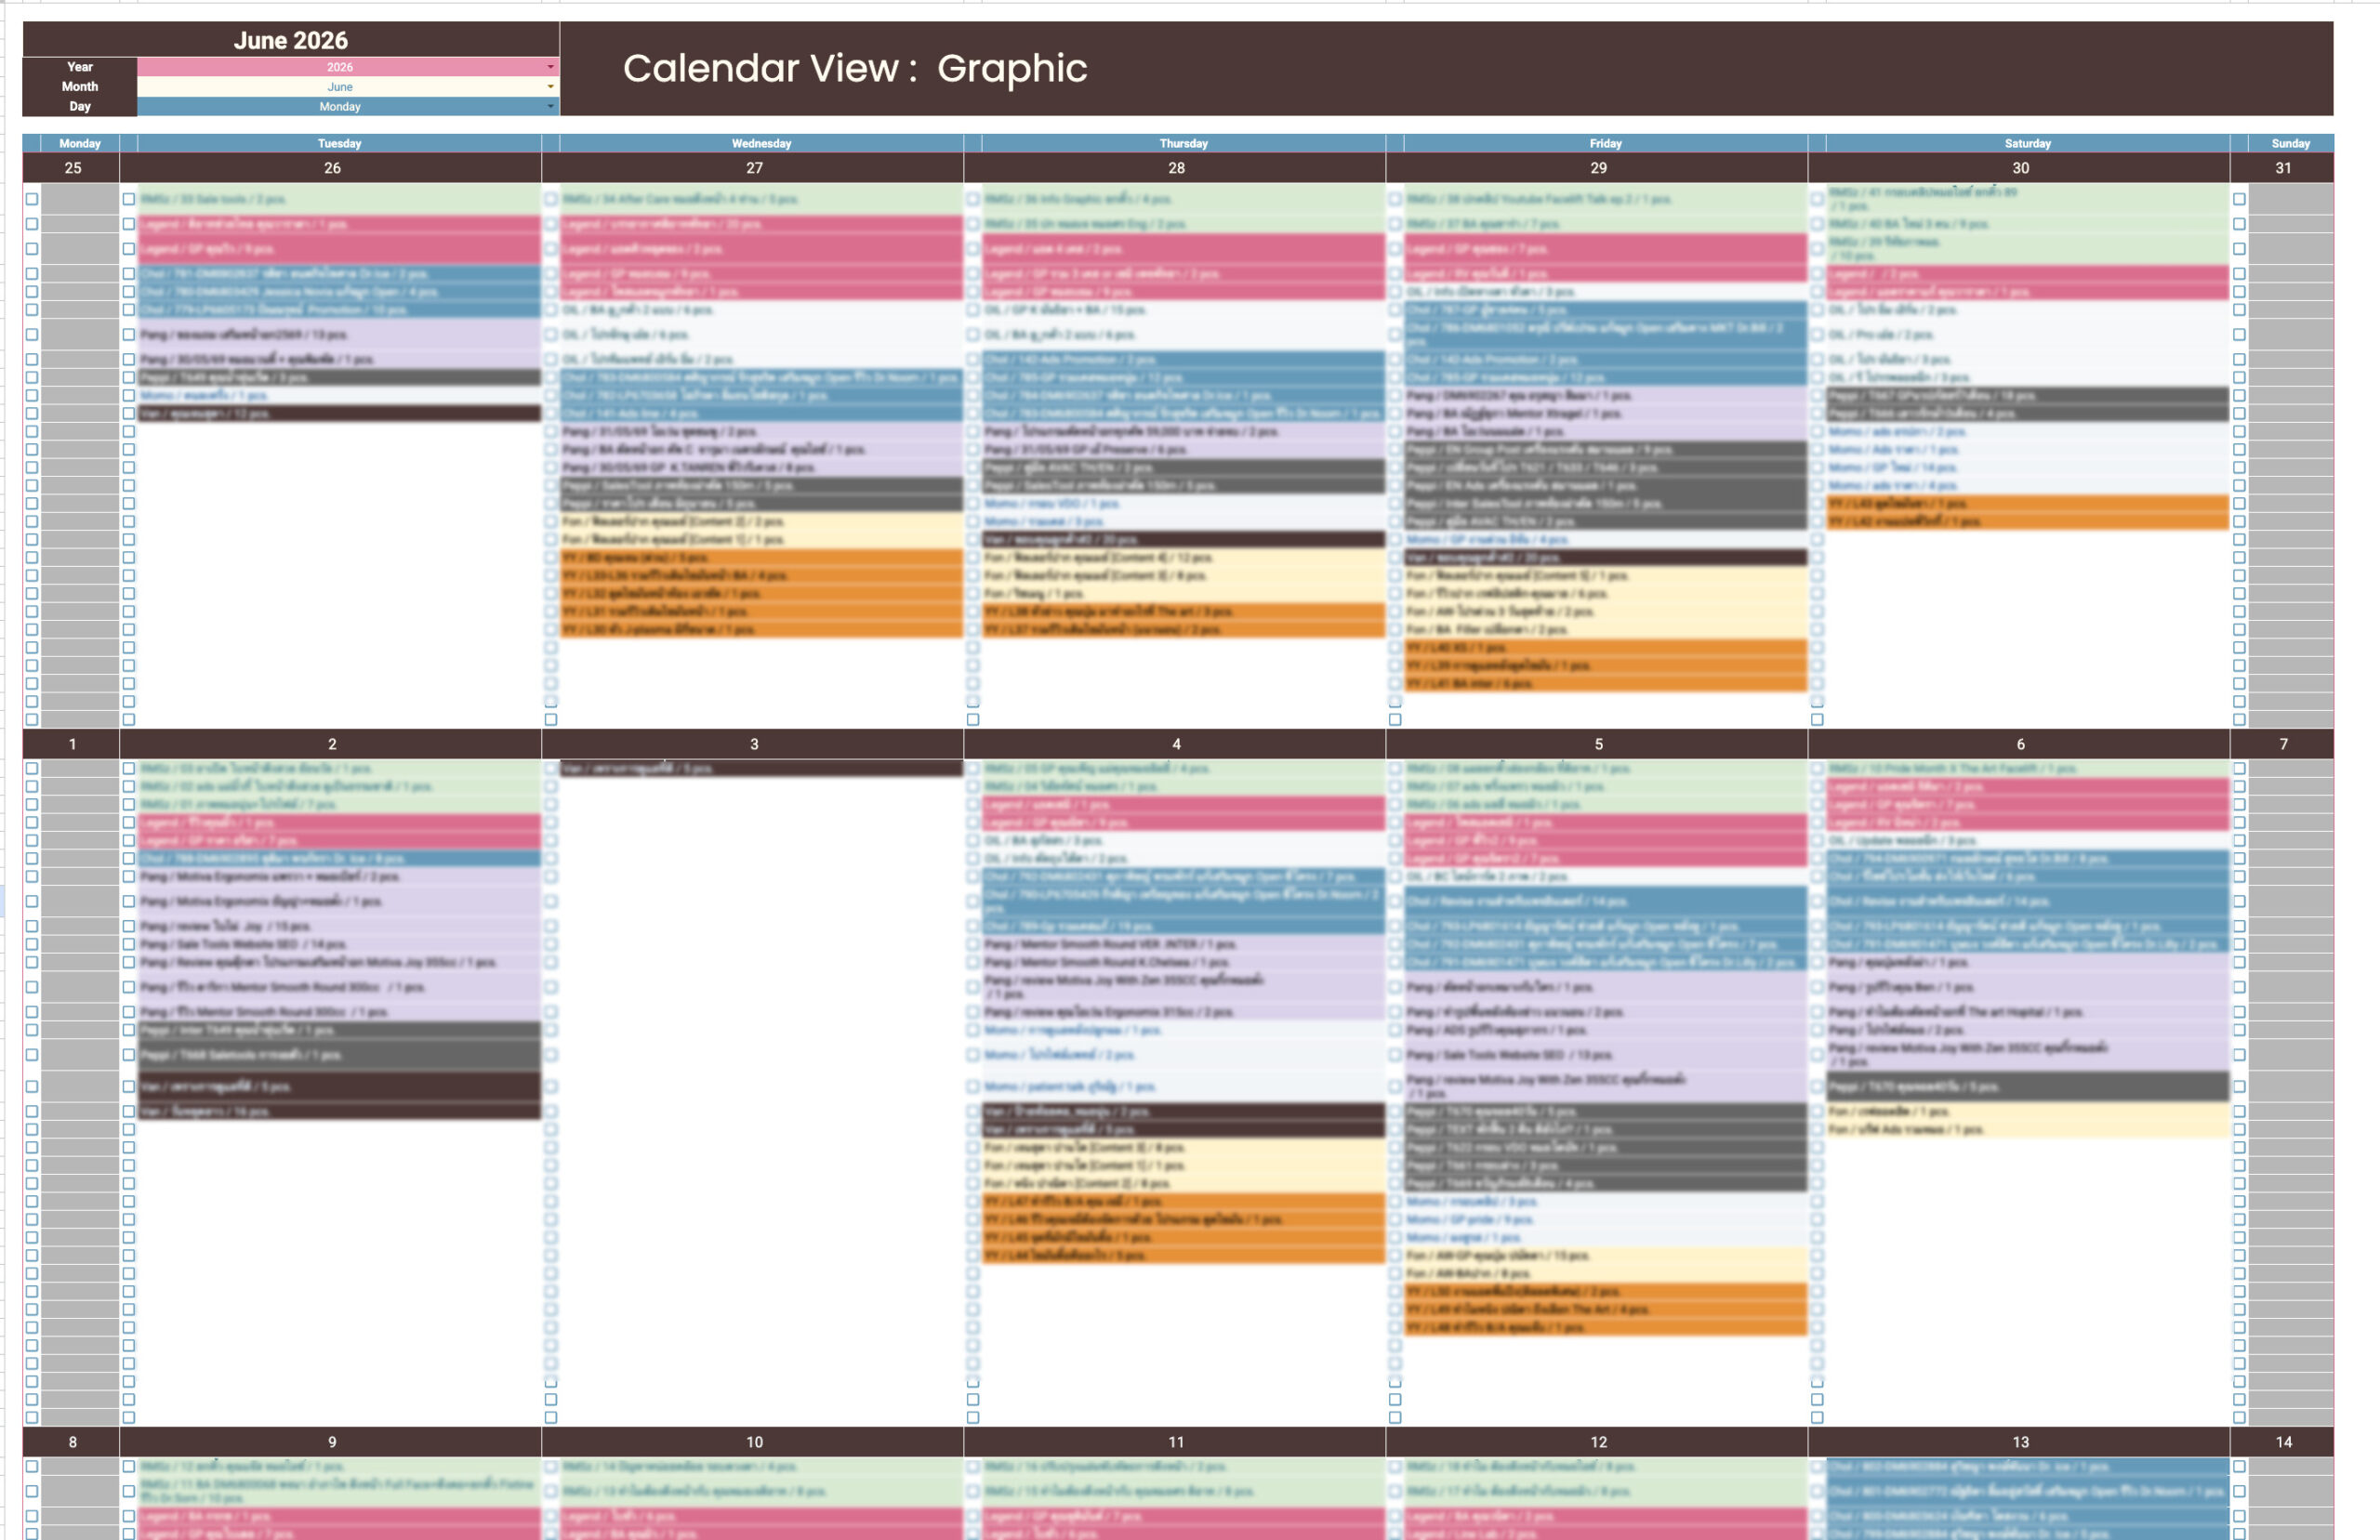
I developed a calendar view that automatically pulls task entries from each graphic designer’s work log into a shared calendar. Whenever a task is created or updated, the information appears under the relevant date.
Team leaders and stakeholders can see upcoming work, task volumes, and workload distribution, reducing repetitive coordination and making deadlines easier to manage.
Automatically pull tasks from individual work logs.
View team schedules and task volumes in a single calendar.
Reduce scheduling conflicts and uneven workloads.
Support real-time planning and task tracking.
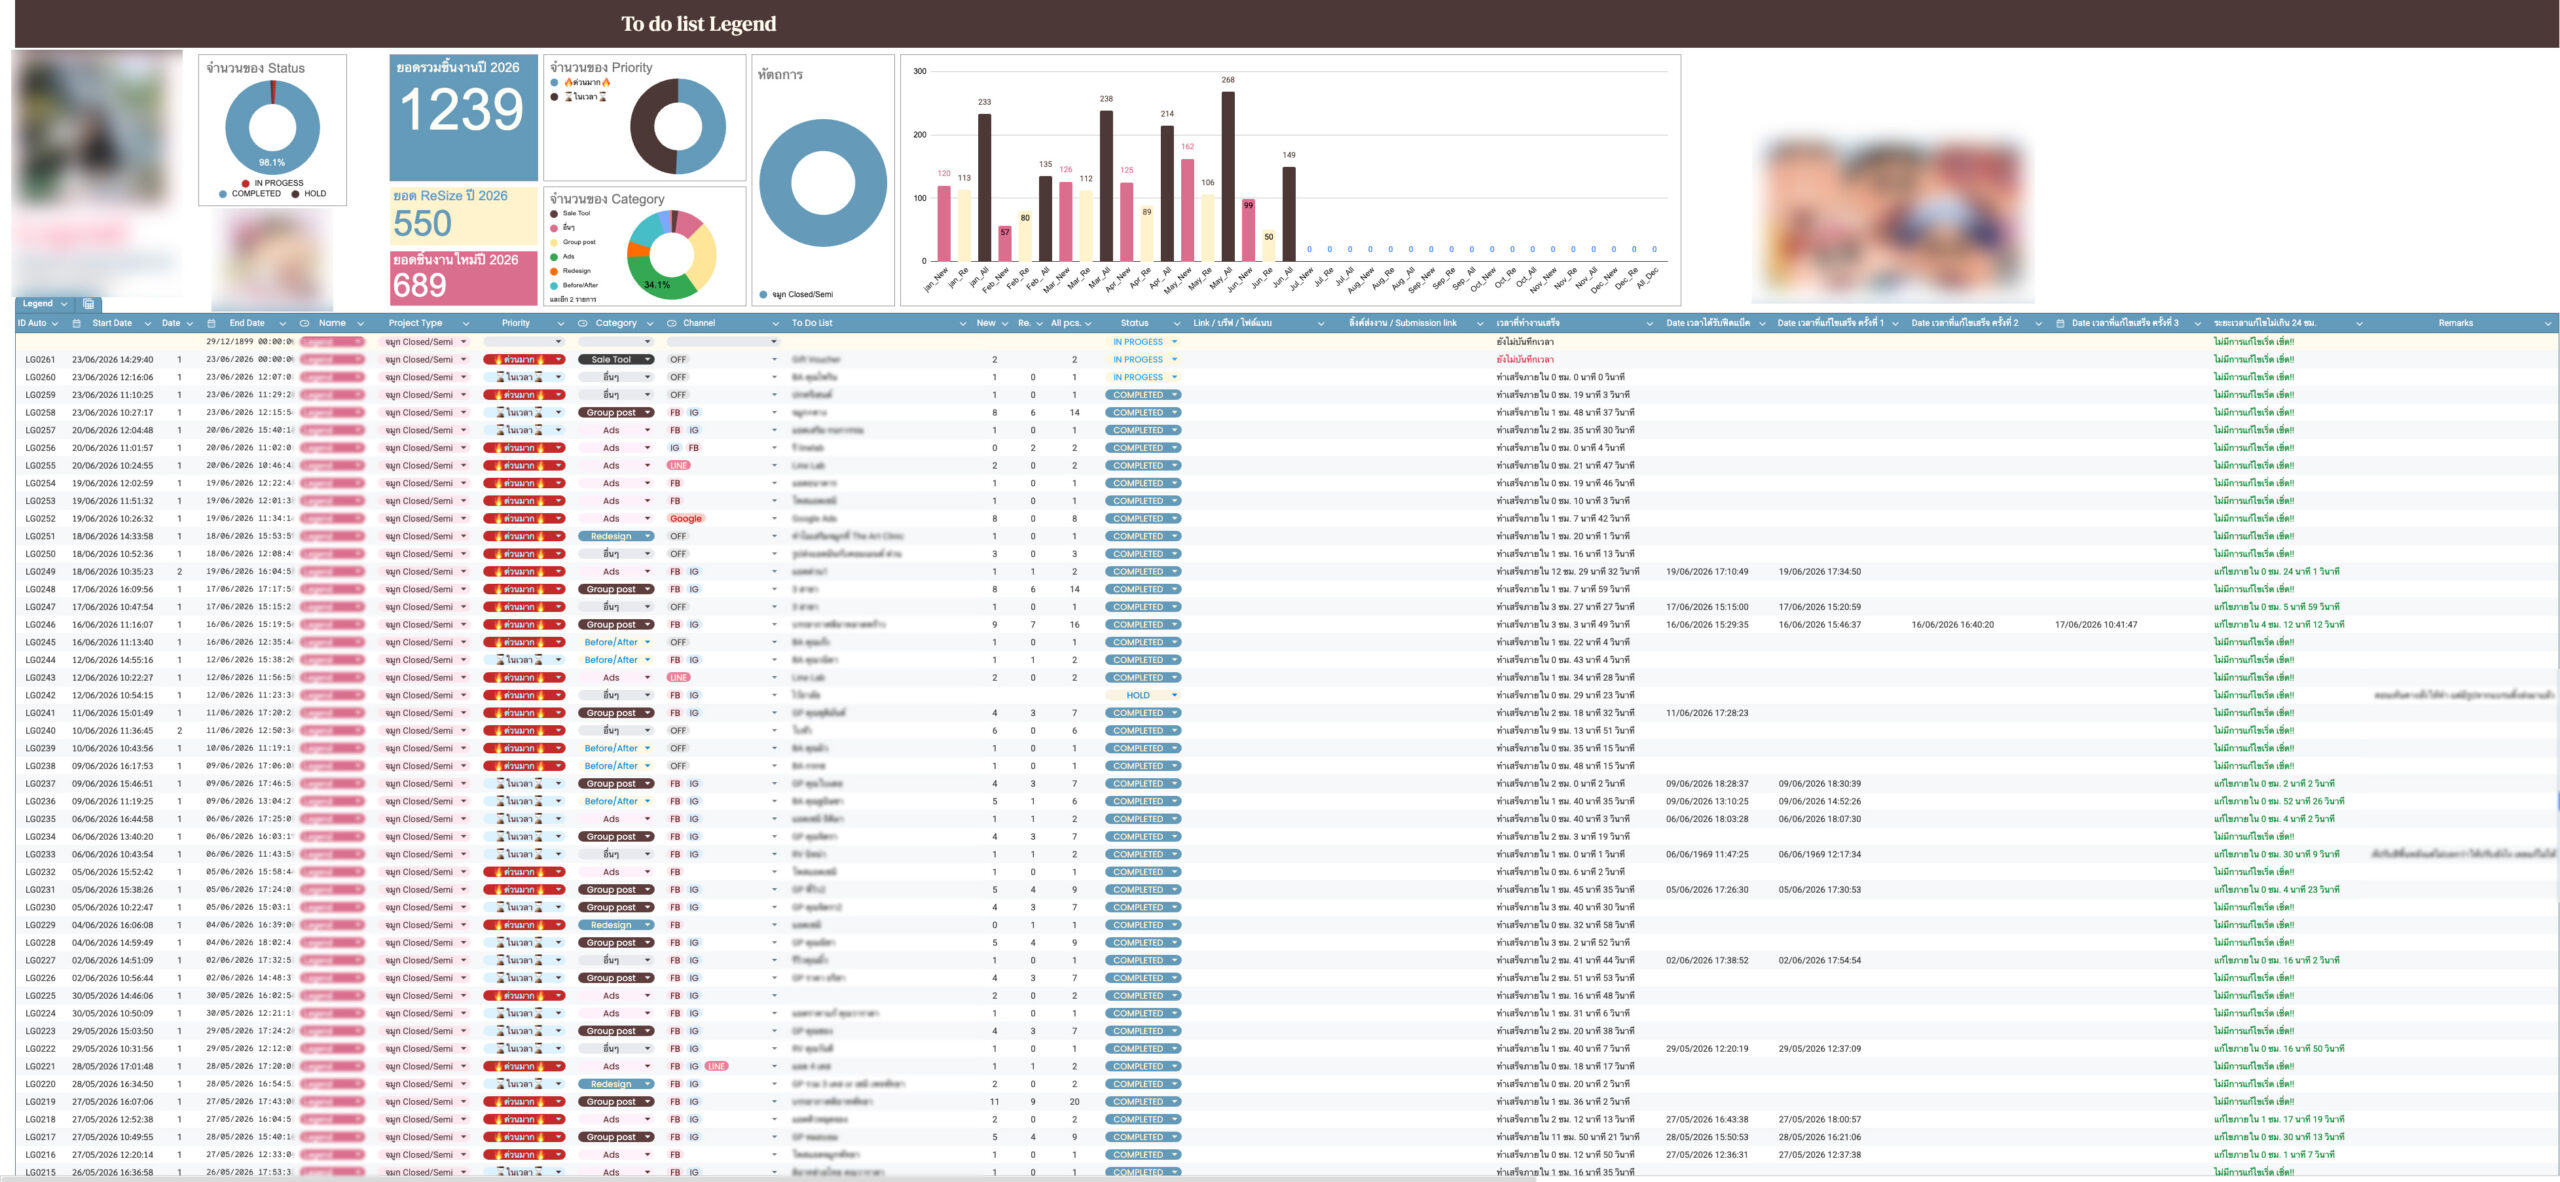
I designed a to-do list system that allows graphic designers to record each task once. The data is then sent to a central database, where deliverable counts, time spent, task statuses, and results are processed automatically.
This makes it easier to track individual performance, analyze productivity, and review work history while reducing manual reporting.
Record each task once and sync the data automatically.
Track individual progress and output in real time.
Analyze performance and productivity using recorded task data.
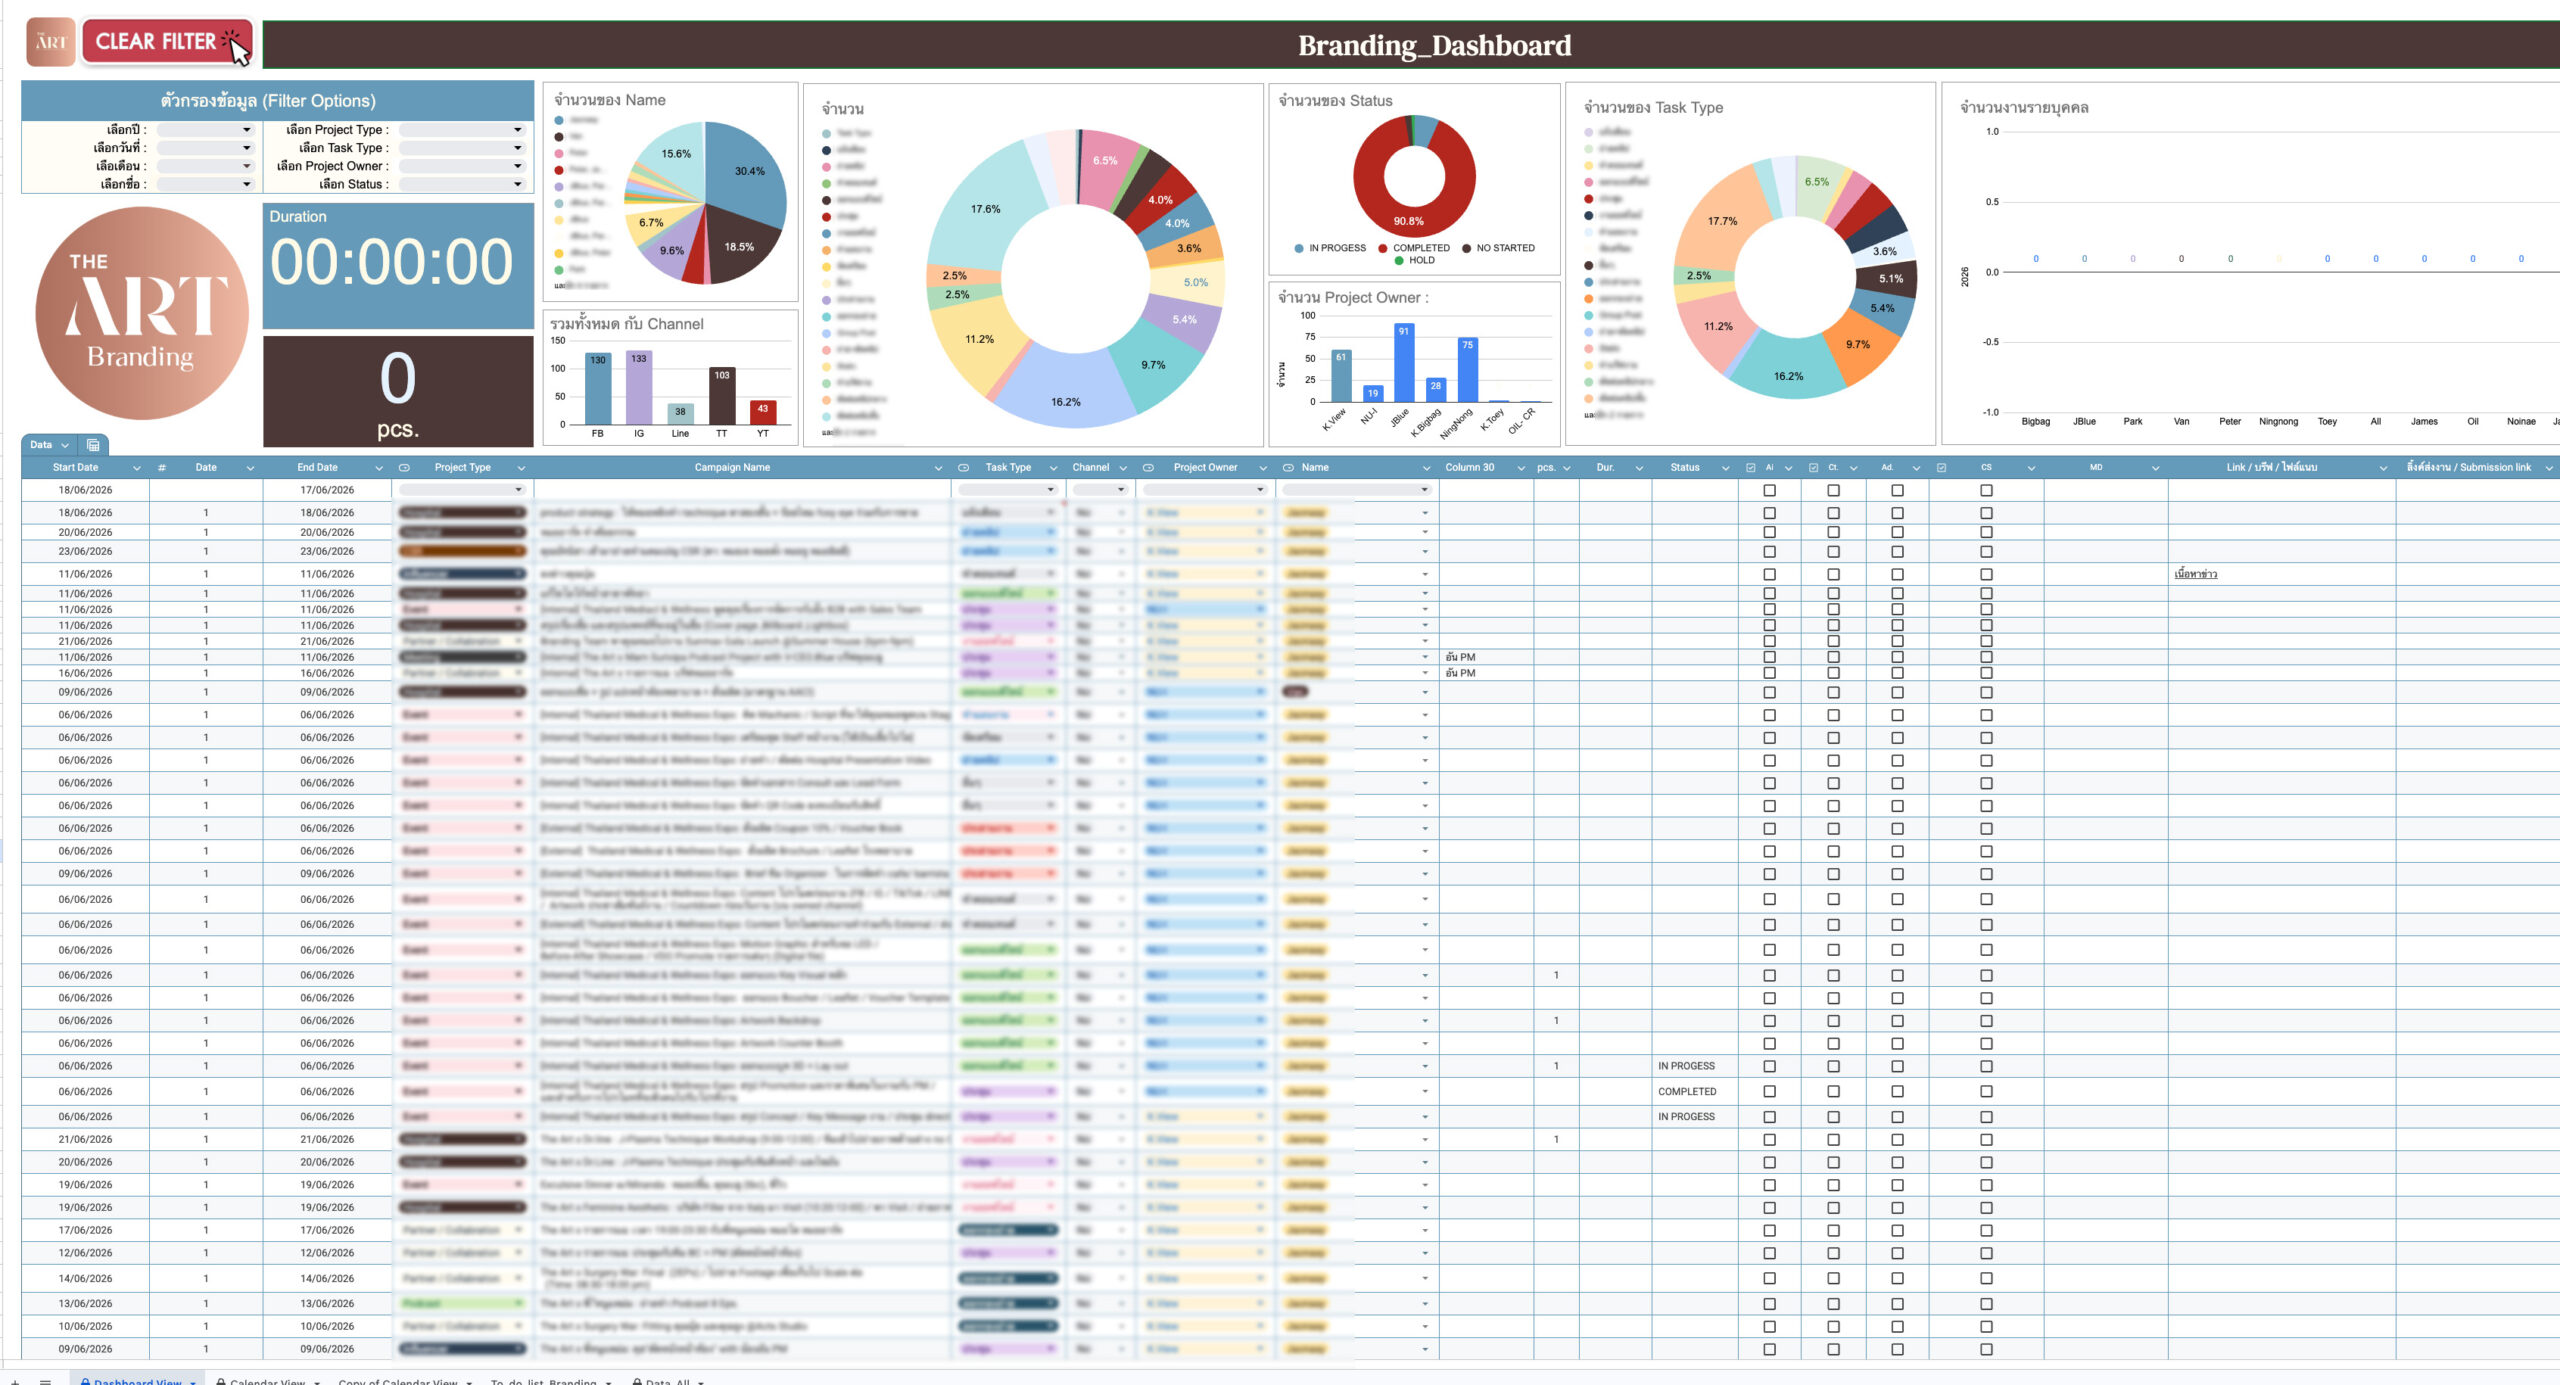
Tracking the branding team’s work previously required gathering updates from multiple sources, including meetings, events, campaigns, partner coordination, and special projects. This made it difficult to monitor progress and maintain an overview of all ongoing work.
I developed a central dashboard that connects task entries to a single database and presents real-time charts and reports. The team can track task statuses, work categories, assigned team members, and task volumes over time.
View all projects and activities in one place.
Track task statuses and responsibilities in real time.
Analyze task volumes and workload distribution.
Support data-driven project management.
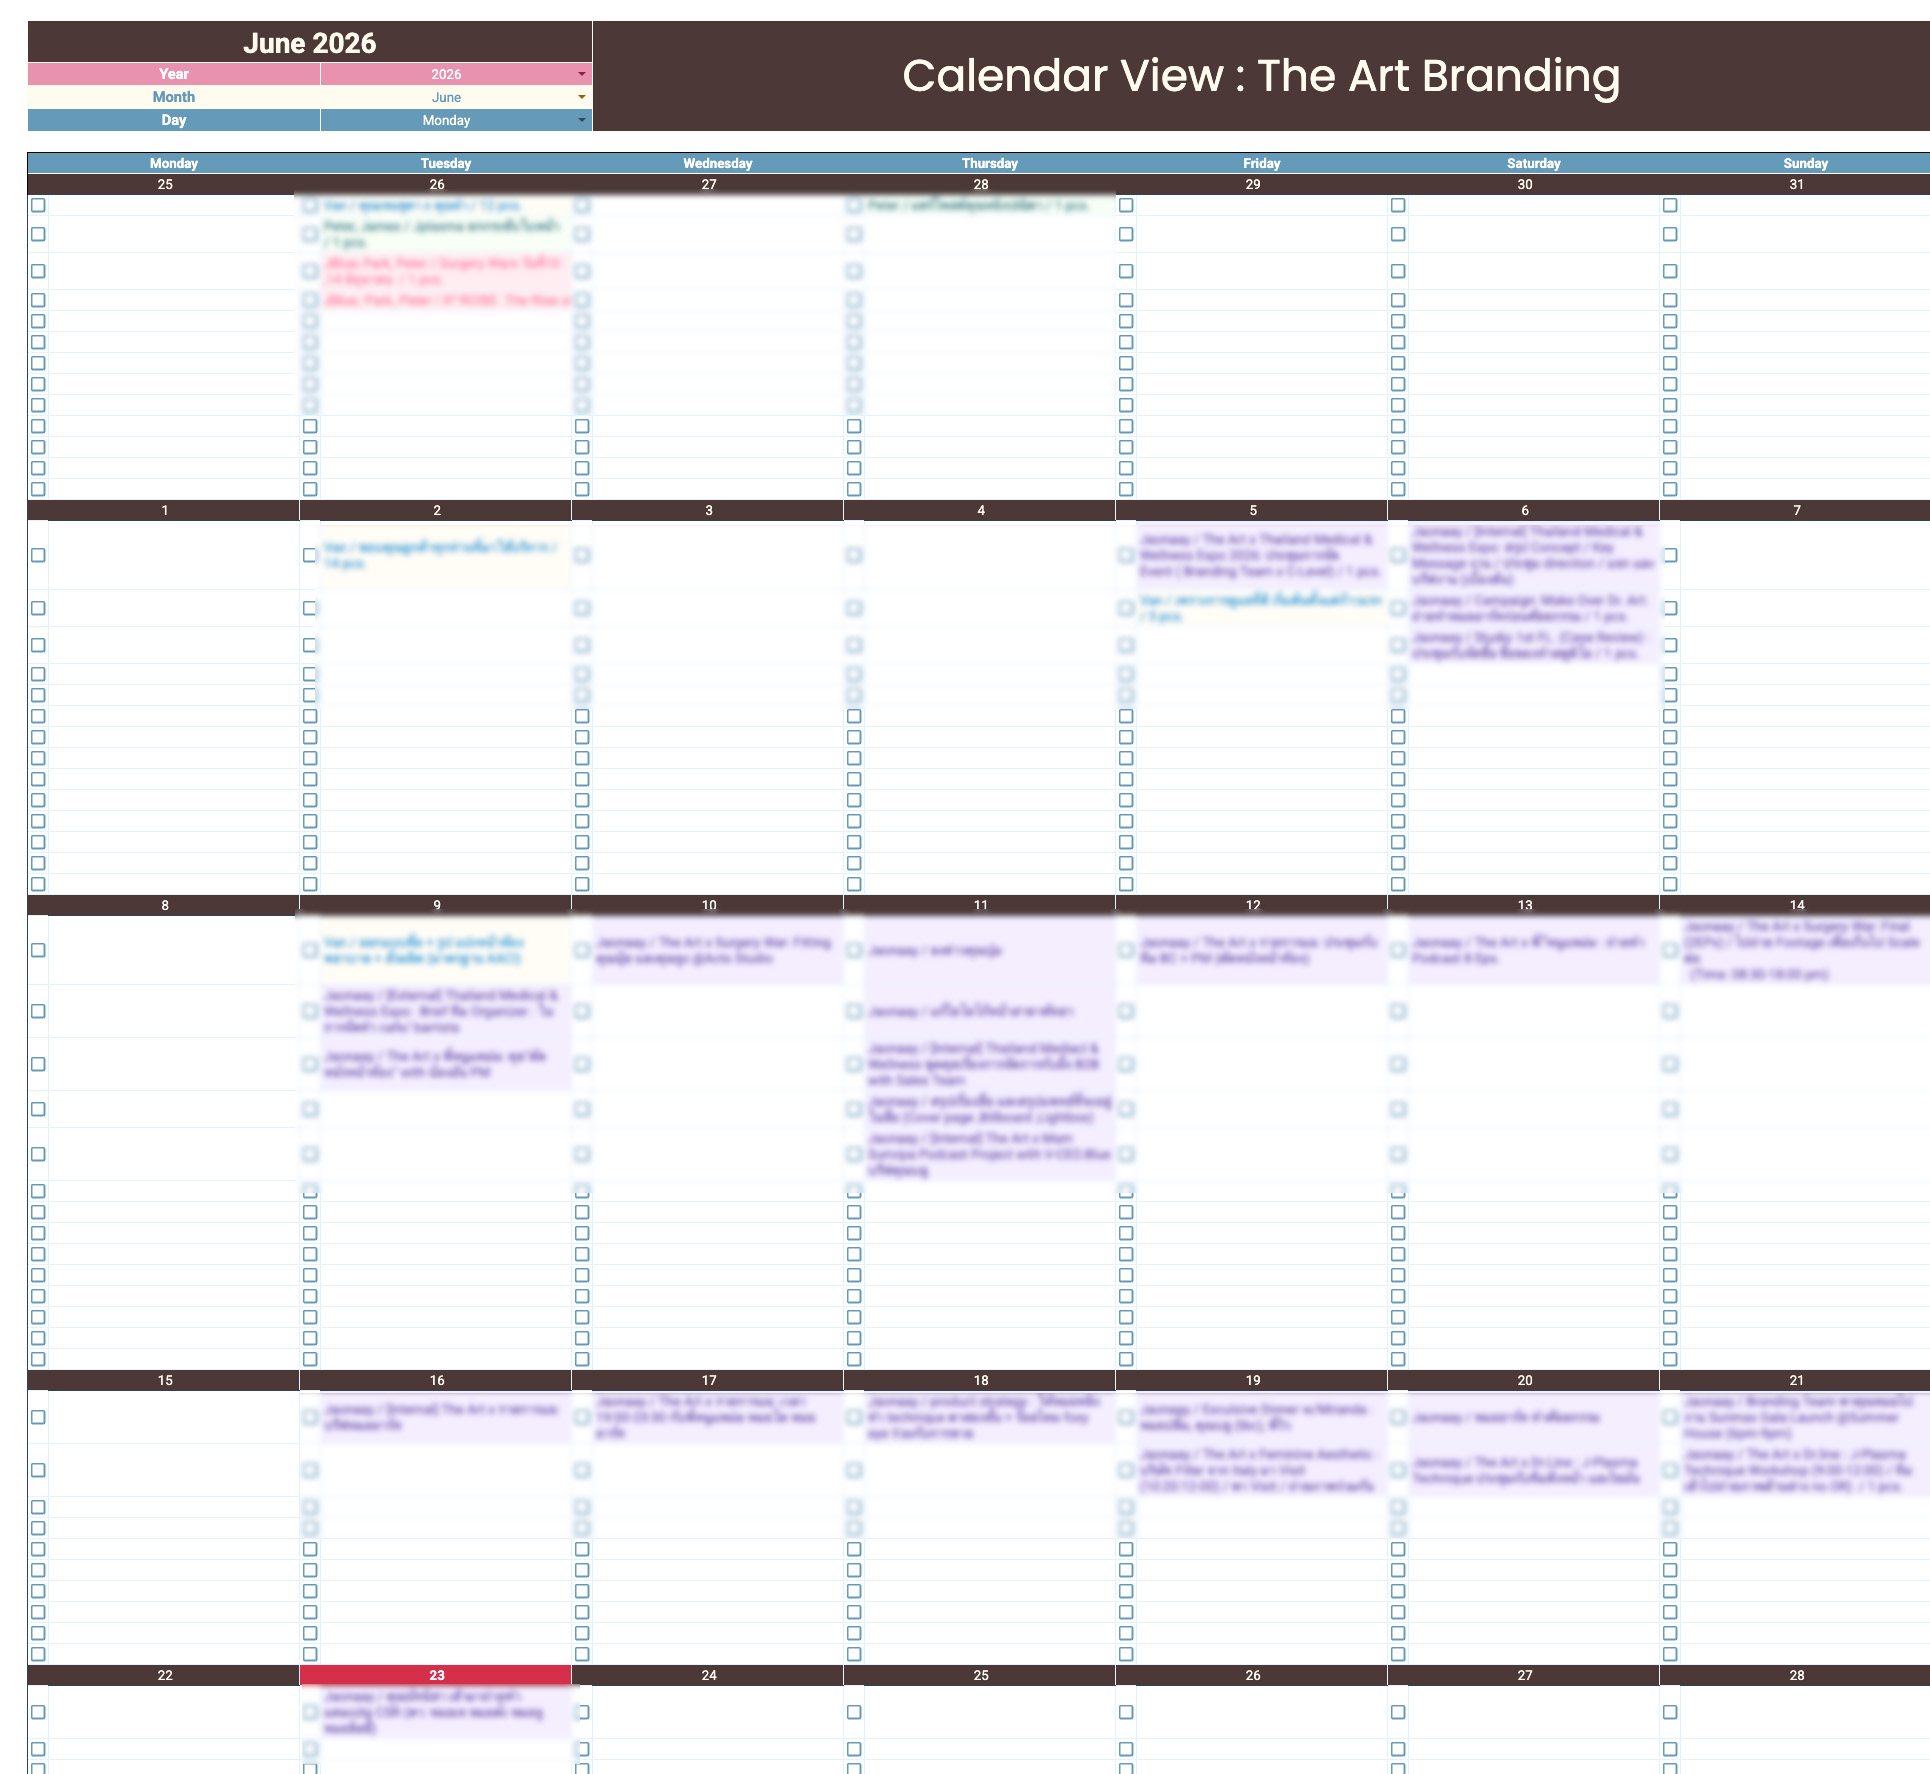
I developed a calendar view that automatically displays information from the branding team’s task entries. Activities, campaigns, meetings, and projects are organized by their scheduled dates.
This helps the team plan ahead, identify busy periods, and allocate resources effectively while reducing the need to track updates across multiple channels.
Automatically sync task entries with the calendar.
View all team plans and activities in one place.
Reduce scheduling conflicts and miscommunication.
Support real-time planning and task tracking.
I designed a to-do list system that allows the branding team to record task details, assign responsibilities, track statuses, and review workflow stages in one place.
All information flows into a central database and supports team-level analysis. This reduces manual follow-ups and helps teams manage projects involving multiple stakeholders more accurately.
Record and track tasks in a single system.
Monitor task statuses and progress in real time.
Automatically sync data with the dashboard and calendar view.
Improve task management and team coordination.
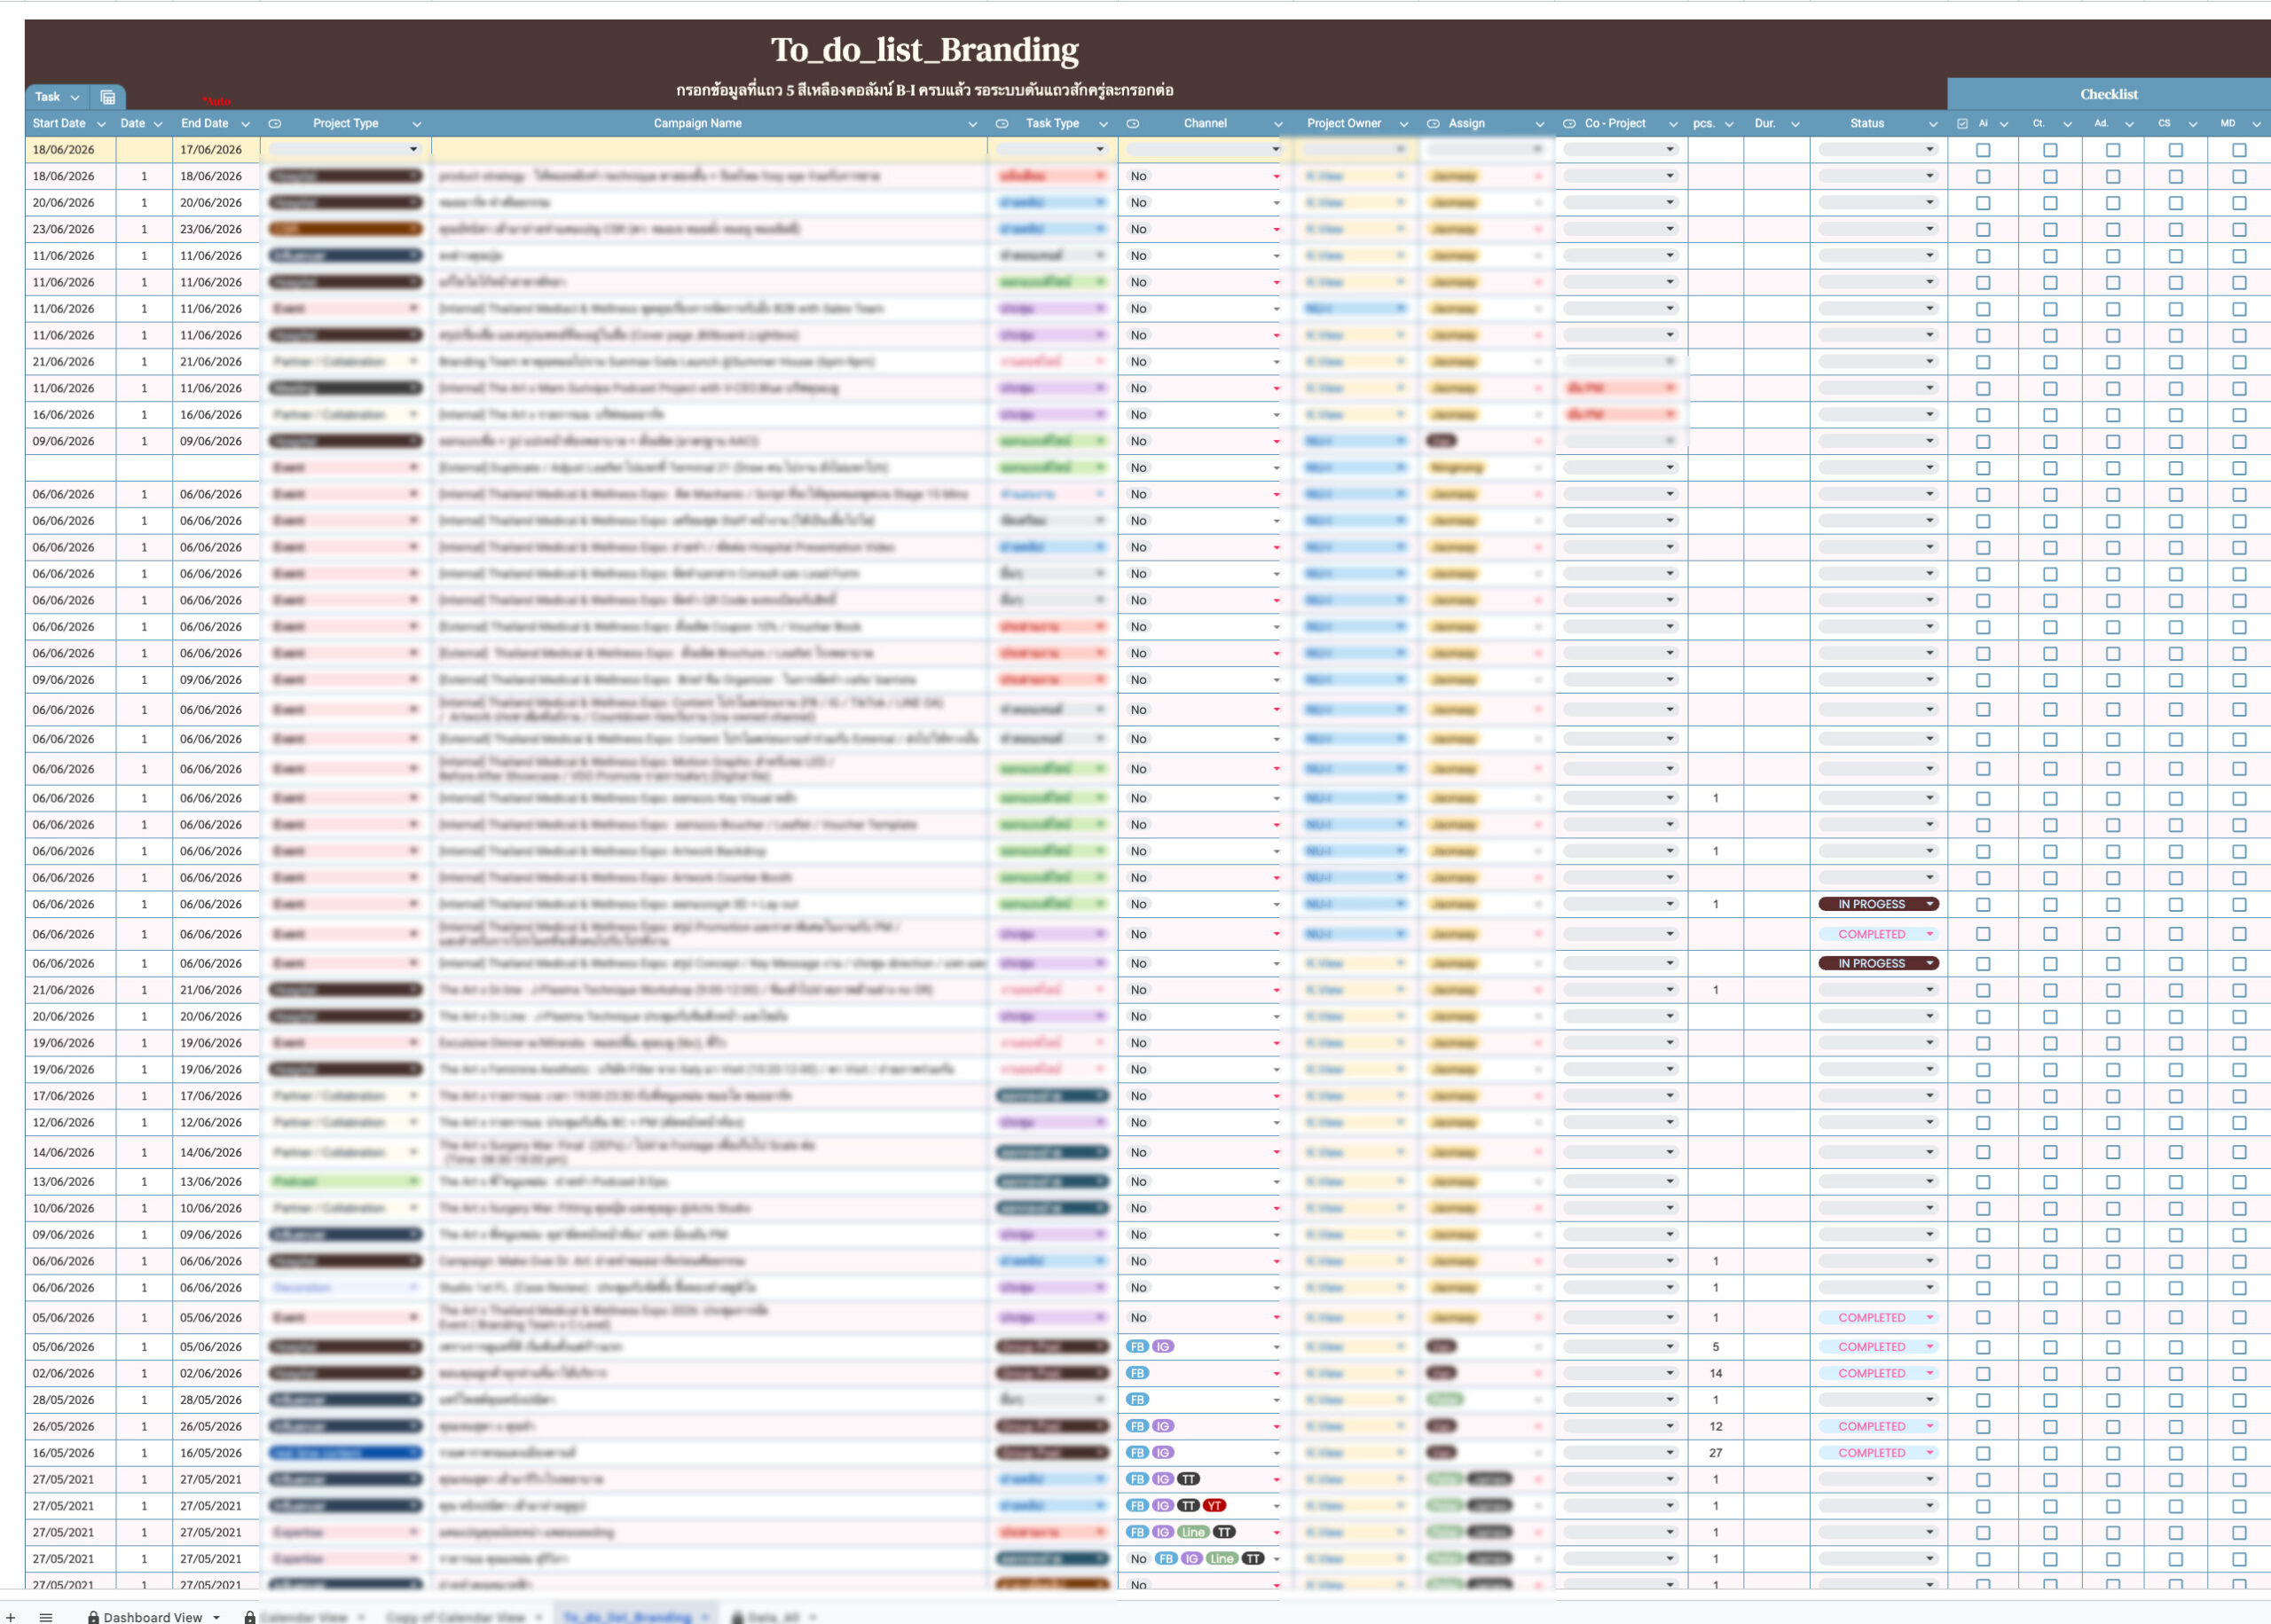
Note: Certain information in this image has been redacted to protect confidential business and internal organizational information.